Government Expenditure and Revenue Scotland 2022-23
Government Expenditure and Revenue Scotland (GERS) is a National Statistics publication. It estimates the revenue raised in Scotland and the cost of public services provided for the benefit of Scotland.
This document is part of a collection
Chapter 3: Public Sector Expenditure
Introduction
This chapter provides detailed estimates of public sector expenditure for Scotland. Expenditure is shown by type of spend, using a presentation based on the UN’s Classification of the Functions of Government (COFOG). Further information is provided in the Glossary in Annex D. Current and capital expenditure are shown separately.
The primary data sources used to estimate Scottish public sector expenditure in GERS are Scottish Government spending reported on the UK Government’s public spending system, OSCAR, and HM Treasury’s Public Expenditure Statistical Analyses (PESA)[22] and the supporting Country and Regional Analysis (CRA).[23]
Spending by the Scottish Government is provided directly by the Scottish Government Directorate for Financial Management. Scottish Local Government spending in all years is taken from HM Treasury’s PESA publication. Spending by other UK government departments spending is based on PESA for 2022-23 and on the CRA for earlier years. Further information on the methodology is set out in the expenditure methodology paper available at the link below.
Economy statistics - gov.scot (www.gov.scot)
GERS also includes some transactions between Scotland and the EU. These can be reported in a number of different ways, and are discussed in more detail later in the chapter.
GERS expenditure figures are presented on a National Accounts basis, an international reporting standard used by governments to ensure international comparability. This requires a number of accounting adjustments to be included in total expenditure. These are primarily symmetric adjustments that also form part of revenue, and therefore have little impact on the net fiscal balance. Further information is set out in Annex A.
Public Sector Expenditure
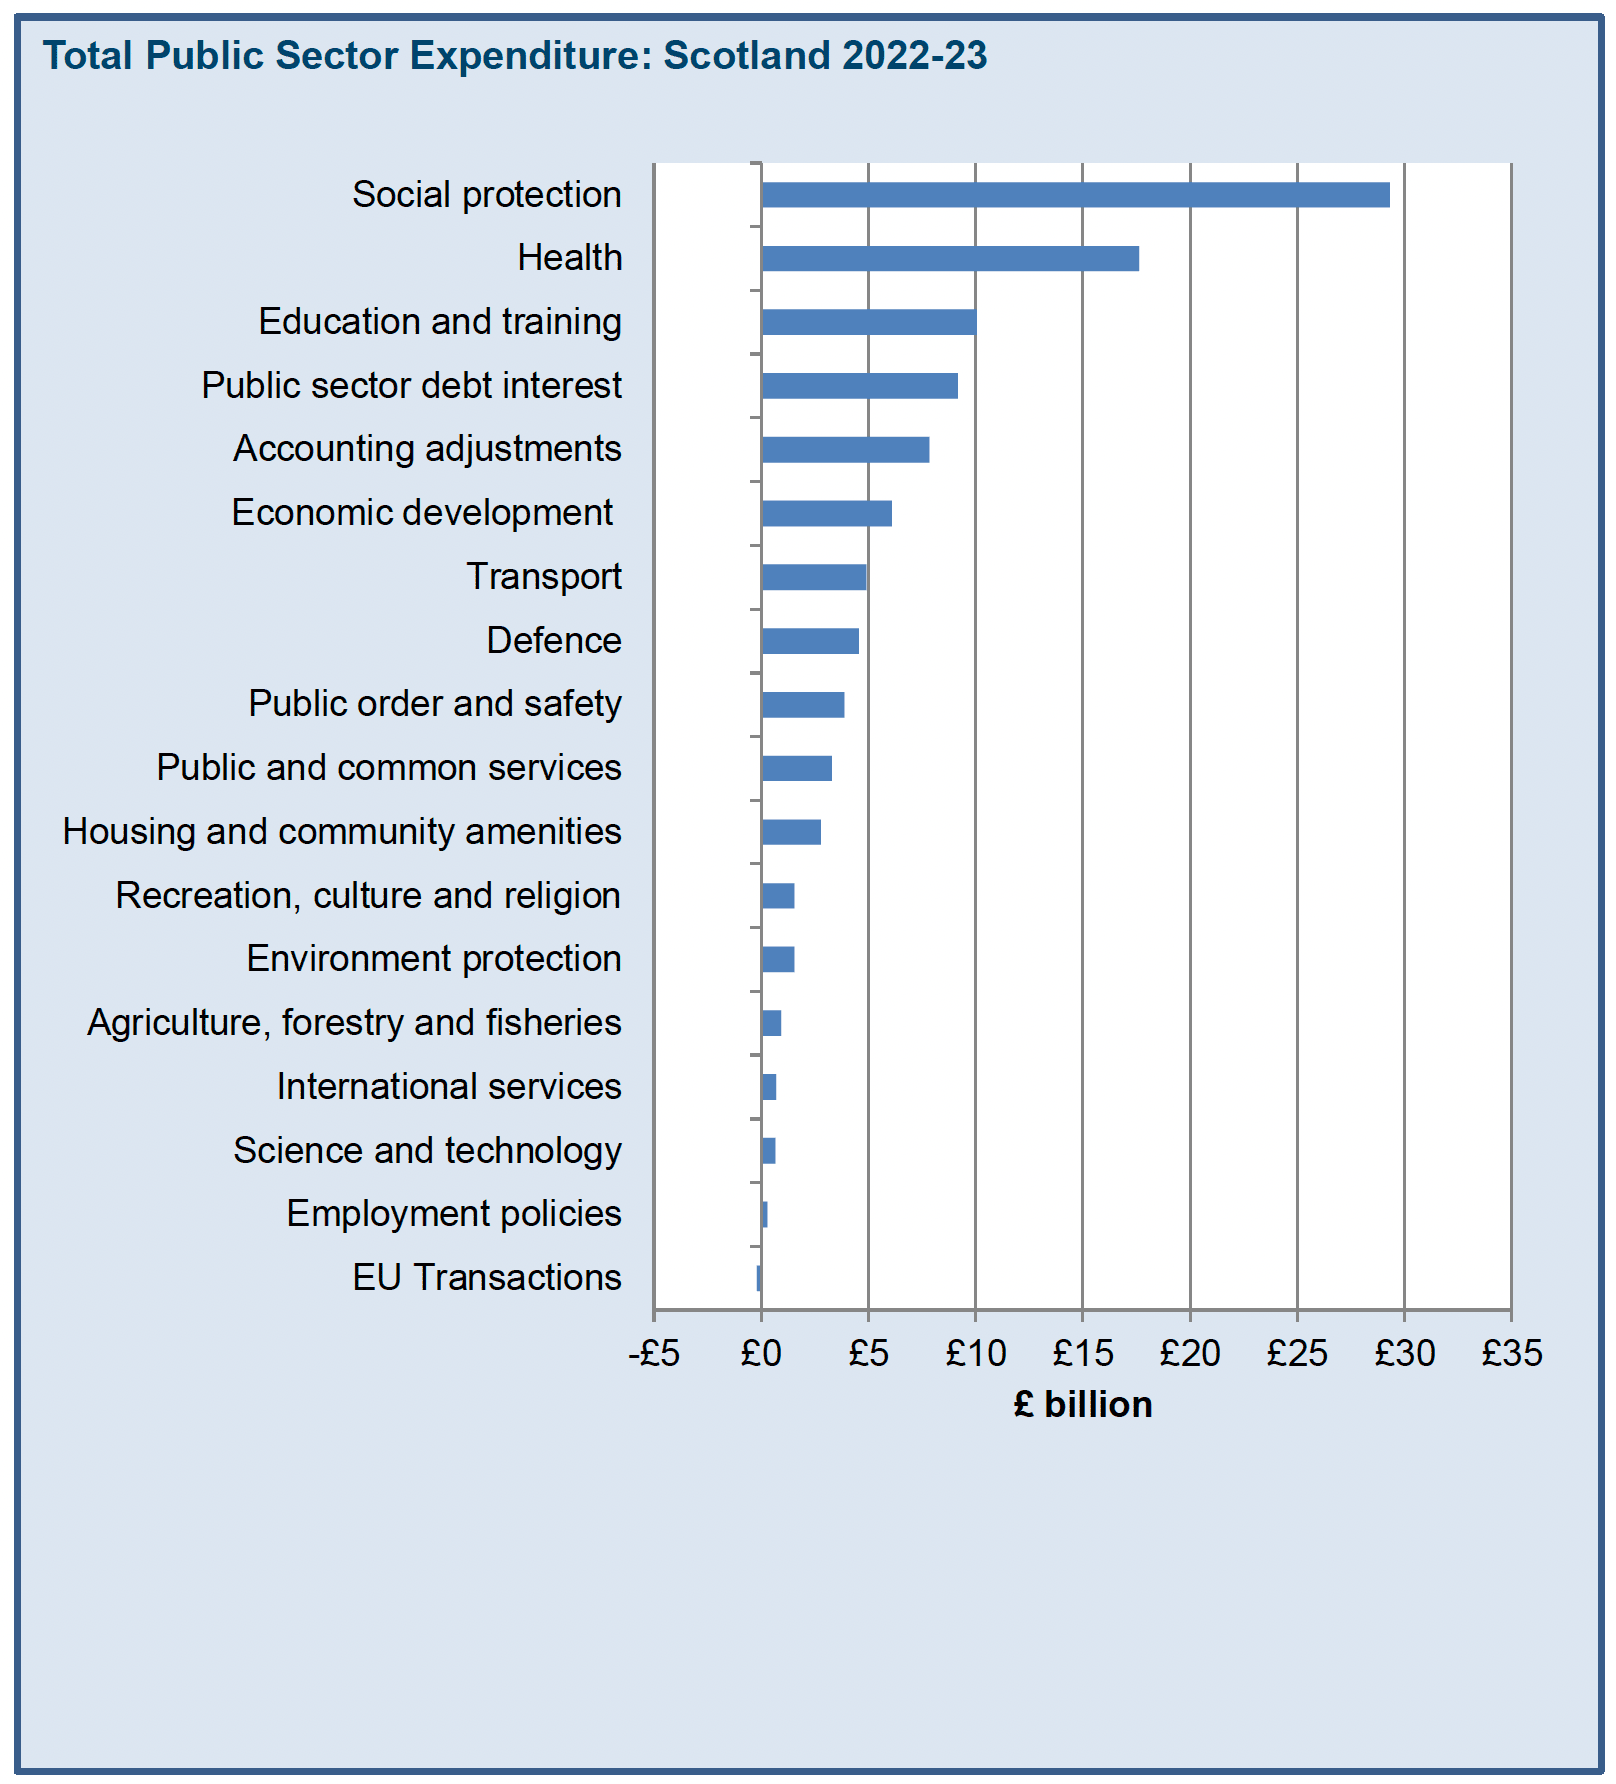
Total public sector expenditure for Scotland in 2022-23 is estimated to be £106.6 billion, with social protection the largest element of spend, accounting for slightly over a quarter of total spend. Spend has increased by 9.3% from 2021-22. This increase primarily reflects the introduction of Cost of Living support schemes for households and businesses, and rises in the cost of reserved debt interest as interest rates and inflation have risen. These are partly offset by falls in health spending as pandemic spending continued to be scaled back. Overall health spend fell by £1.6 billion to £17.6 billion, although this is still almost a third higher than spending in 2019-20. Further information on reserved spending in response to the Cost of Living is set out in Box 3.1.
Table 3.1 shows a breakdown of spending by category.
| Scotland | ||
|---|---|---|
| £ million | % of total expenditure | |
| General public services | ||
| Public and common services | 3,276 | 3.1% |
| International services | 694 | 0.7% |
| Reserved public sector debt interest | 9,169 | 8.6% |
| Local government pension fund interest expenditure | 1,751 | 1.6% |
| Defence | 4,540 | 4.3% |
| Public order and safety | 3,881 | 3.6% |
| Economic affairs | ||
| Enterprise and economic development | 6,082 | 5.7% |
| Science and technology | 654 | 0.6% |
| Employment policies | 290 | 0.3% |
| Agriculture, forestry and fisheries | 922 | 0.9% |
| Transport | 4,897 | 4.6% |
| Environment protection | 1,537 | 1.4% |
| Housing and community amenities | 2,766 | 2.6% |
| Health | 17,615 | 16.5% |
| Recreation, culture and religion | 1,547 | 1.5% |
| Education and training | 10,046 | 9.4% |
| Social protection | 29,311 | 27.5% |
| EU transactions | -186 | -0.2% |
| Accounting adjustments | 7,843 | 7.4% |
| Total Expenditure | 106,635 | 100% |
Table 3.2 below shows growth in current and capital spend in Scotland by organization in 2022-23, compared to the UK. Spending grew more slowly in Scotland than the UK as a whole. This primarily reflects that in the areas of spending which are growing fastest, such as reserved debt interest payments and cost of living support, Scotland receives a share similar to its population, which is lower than its overall spending share. Note that the growth rate for UK public corporation spending is affected by one-off capital receipts in 2021-22 relating to public sector pensions, which reduced spending in this year, leading to very high growth in 2022-23.
Box 3.1: Spending associated with reserved cost of living support packages
Inflation increased significantly across 2021-22 and into 2022-23, driven by rising energy prices. CPI inflation at the beginning of 2021-22 was 1.5%, and increased to a peak of 11.1% in October 2022. In response, the UK and Scottish Governments announced a range of measures to help households and businesses with rising costs. Details of the Scottish Government policies are available at: Cost of living crisis - gov.scot (www.gov.scot)
The reserved UK Government support schemes provided over £50 billion of support for the UK across 2022‑23. The key interventions were:
- Energy Price Guarantee – which limited the amount a typical household would pay for energy to £2,500.
- Energy Bill Support Scheme – which provided a £400 discount to household energy bills over the winter, which they received across October 2022 to March 2023.
- Energy Bill Relief Scheme – which ran between 1 October 2022 and 31 March 2023, and provided a limit on the price paid by businesses.
- Cost of Living Payments – payments of between £150 to £650 were made to people on low incomes, people in receipt of qualifying disability benefits, and pensioners entitled to Winter Fuel Payments.
The cost of these schemes in Scotland has been estimated based on:
- Energy Price Guarantee – the Scottish share of UK consumption of electricity and gas by domestic customers.
- Energy Bill Support Scheme – the Scottish share of UK households.
- Energy Bill Relief Scheme – the Scottish share of UK consumption of electricity and gas by non-domestic customers.
- Cost of Living Payments – the Scottish share of Universal Credit or relevant qualifying social security.
The table below summarises the costs for Scotland associated with the schemes above in this edition of GERS.
| Scotland | UK | Share | |
|---|---|---|---|
| Energy price guarantee (households)1 | 2,042 | 23,000 | 8.9% |
| Energy price guarantee (businesses)1 | 615 | 6,700 | 9.2% |
| Energy bills support scheme2 | 1,031 | 12,500 | 8.2% |
| £650 means tested Cost of Living payment3 | 465 | 5,460 | 8.5% |
| £300 pensioner Cost of Living payment3 | 223 | 2,564 | 8.7% |
| £150 disability Cost of Living payment3 | 94 | 919 | 10.2% |
| Total | 4,470 | 51,142 | 8.7% |
Sources:
1 OBR Economic and Fiscal Outlook March 2023, Scottish Government calculations
2 OBR Economic and Fiscal Outlook March 2023, Scottish Government calculations. Includes Alternative Fuels Payment.
3 OSCAR 2022-23 transparency data, Scottish Government calculations.
| Scotland | UK growth | |||
|---|---|---|---|---|
| 2021-22 | 2022-23 | Growth | ||
| Current expenditure | 86,813 | 95,129 | 9.6% | 11.2% |
| Scottish Government | 37,961 | 37,557 | -1.1% | -1.1% |
| Local Government | 15,916 | 16,632 | 4.5% | 4.2% |
| Public Corporations | - | - | - | - |
| Other UK Government bodies | 32,936 | 40,941 | 24.3% | -3.0% |
| Capital expenditure | 10,567 | 11,506 | 8.9% | 8.6% |
| Scottish Government | 3,976 | 4,376 | 10.1% | 10.1% |
| Local Government | 2,347 | 2,489 | 6.1% | -0.4% |
| Public Corporations | 1,565 | 1,777 | 13.6% | 94.9% |
| Other UK Government bodies | 2,680 | 2,864 | 6.9% | -11.6% |
| Total expenditure | 97,380 | 106,635 | 9.5% | 10.9% |
| Scottish Government | 41,937 | 41,933 | 0.0% | 0.0% |
| Local Government | 18,263 | 19,121 | 4.7% | 3.7% |
| Public Corporations | 1,565 | 1,777 | 13.6% | 94.9% |
| Other UK Government bodies | 35,615 | 43,804 | 23.0% | -3.9% |
Notes:
1. Public corporation line for Scotland shows spending by Scottish public corporations only. UK figure shows spending by all public corporations
2. Public corporations have no current expenditure as this is netted off against their income to provide their gross operating surplus in the revenue calculations. Consistent with the CRA, interest expenditure by public corporations is recorded as spending by HM Treasury.
3. Spend by Other UK Government departments for Scotland and the UK are not directly comparable, as spending for the UK as a whole includes spending on functions which are devolved to the Scottish Government.
Table 3.3 shows the split of total expenditure between current and capital for Scotland.
| per cent | |||
|---|---|---|---|
| 2020-21 | 2021-22 | 2022-23 | |
| Current | 89.0% | 89.2% | 89.2% |
| Capital | 11.0% | 10.8% | 10.8% |
| Per cent of GDP | |||
|---|---|---|---|
| 2020-21 | 2021-22 | 2022-23 | |
| Scottish expenditure as a Share of GDP: | |||
| Excl. North Sea GDP | 65.8% | 55.9% | 56.2% |
| Incl. population share of North Sea GDP | 65.4% | 55.2% | 55.6% |
| Incl. geographical share of North Sea GDP | 61.9% | 50.1% | 50.1% |
| UK expenditure as a share of GDP: | |||
| 100% of North Sea GDP | 53.1% | 44.5% | 45.6% |
Table 3.5 shows total public sector expenditure per person for Scotland and the UK. The relative gap between Scottish and UK spending per person increased in 2021‑22 but narrowed in 2022‑23, with spend per person 12.9% points higher. This narrowing reflects the increased spending on reserved debt interest and cost of living support, where Scotland broadly receives a population increase of UK spending. Note that per person figures will be subject to future revision when mid-year population estimates are published following the release of the Scottish Census 2022.
As noted previously, water and sewerage services are provided by the public sector in Scotland, but by the private sector in England and Wales, leading to relatively higher spending in Scotland. This explains slightly less than one percentage point of the difference in spend.
Tables 3.6 and 3.7 show current, capital, and total expenditure for Scotland and the UK respectively.
| £ per person | |||
|---|---|---|---|
| 2020-21 | 2021-22 | 2022-23 | |
| Scotland | 18,334 | 17,770 | 19,459 |
| UK | 16,505 | 15,549 | 17,243 |
| Difference (Scotland minus UK) | 1,829 | 2,222 | 2,217 |
| Difference between Scottish and UK (%) | 11.1% | 14.3% | 12.9% |
Box 3.2 Social protection spending in Scotland
Social protection spending is the largest single spending line in GERS, and covers a range of different spend types.
The largest spending element within social protection is expenditure on the state pension by the Department for Work and Pensions (DWP). This is followed by DWP’s spending on other social security such as universal credit disability and incapacity related benefits, and housing benefit. Tax credits and child benefit are part of HMRC spending. Scottish Government social security spend includes the Scottish Welfare Fund, Council Tax Reduction Scheme, and Scottish Government expenditure on Discretionary Housing Payments, all of which are administered by Local Authorities. From 2018-19, it also includes spending on newly devolved social security, as set out in Chapter 4.
Some UK social security expenditure, mostly associated with the state pension, is paid to non-UK residents. Scotland is allocated a population share of this expenditure in GERS.
| 2020-21 | 2021-22 | 2022-23 | |
|---|---|---|---|
| Social security spending in Scotland | |||
| State pension | 8,501 | 8,782 | 9,305 |
| Housing benefit | 1,380 | 1,286 | 1,178 |
| Universal credit | 2,909 | 3,074 | 3,537 |
| Other DWP social security | 2,707 | 2,506 | 2,778 |
| HMRC child benefit and tax credits | 1,832 | 1,541 | 1,468 |
| Scottish Government social security | 3,871 | 3,961 | 4,484 |
| Social security spending in Scotland | 21,199 | 21,149 | 22,752 |
| Share of benefit spending outside UK | 359 | 369 | 380 |
| Share of corporate spend | 93 | 109 | 128 |
| Other social protection | |||
| Net public sector pensions | 216 | 179 | 135 |
| Social care for the elderly | 2,625 | 2,871 | 3,141 |
| Other | 1,605 | 1,694 | 2,776 |
| Total social protection | 26,097 | 26,371 | 29,311 |
Other social protection spending consists primarily of Local Authority expenditure on social care to families and children.
A more detailed breakdown of social security spending is published by DWP, available at the link below.
Benefit expenditure and caseload tables - GOV.UK (www.gov.uk)
Spending by different parts of the Public Sector
Table 3.8 below provides a breakdown of Scottish expenditure by the Scottish Government, Scottish local government and public corporations, and other UK government bodies.| Current | Capital | Total | |||||||
|---|---|---|---|---|---|---|---|---|---|
| 2020-21 | 2021-22 | 2022-23 | 2020-21 | 2021-22 | 2022-23 | 2020-21 | 2021-22 | 2022-23 | |
| General public services | |||||||||
| Public and common services | 1,782 | 2,760 | 2,895 | 324 | 367 | 382 | 2,106 | 3,127 | 3,276 |
| International services | 739 | 561 | 553 | 177 | 128 | 142 | 916 | 689 | 694 |
| Public sector interest expenditure | 4,071 | 6,507 | 10,920 | 0 | 0 | 0 | 4,071 | 6,507 | 10,920 |
| Defence | 2,622 | 2,689 | 2,738 | 1,005 | 1,285 | 1,802 | 3,627 | 3,974 | 4,540 |
| Public order and safety | 3,170 | 3,341 | 3,643 | 227 | 227 | 238 | 3,397 | 3,568 | 3,881 |
| Economic affairs | |||||||||
| Enterprise and economic development | 9,797 | 3,701 | 5,263 | 1,702 | 391 | 819 | 11,499 | 4,093 | 6,082 |
| Science and technology | 15 | 44 | 24 | 589 | 575 | 630 | 604 | 620 | 654 |
| Employment policies | 191 | 316 | 285 | 6 | 10 | 5 | 197 | 326 | 290 |
| Agriculture, forestry and fisheries | 799 | 755 | 762 | 118 | 146 | 161 | 917 | 901 | 922 |
| Transport | 2,637 | 2,425 | 2,143 | 1,963 | 2,185 | 2,754 | 4,600 | 4,610 | 4,897 |
| Environment protection | 952 | 980 | 966 | 534 | 500 | 571 | 1,486 | 1,480 | 1,537 |
| Housing and community amenities | 216 | 157 | 276 | 1,870 | 2,300 | 2,490 | 2,087 | 2,457 | 2,766 |
| Health | 17,516 | 18,466 | 16,724 | 650 | 723 | 891 | 18,167 | 19,189 | 17,615 |
| Recreation, culture and religion | 1,267 | 1,289 | 1,247 | 204 | 279 | 300 | 1,471 | 1,568 | 1,547 |
| Education and training | 8,947 | 9,225 | 9,011 | 1,118 | 1,069 | 1,036 | 10,066 | 10,294 | 10,046 |
| Social protection | 25,971 | 26,192 | 29,147 | 126 | 179 | 164 | 26,097 | 26,371 | 29,311 |
| EU Transactions | 686 | -162 | -186 | 0 | 0 | 0 | 686 | -162 | -186 |
| Accounting adjustments | 7,852 | 7,565 | 8,720 | 430 | 203 | -877 | 8,282 | 7,768 | 7,843 |
| Total | 89,232 | 86,813 | 95,129 | 11,043 | 10,567 | 11,506 | 100,275 | 97,380 | 106,635 |
| Current | Capital | Total | |||||||
|---|---|---|---|---|---|---|---|---|---|
| 2020-21 | 2021-22 | 2022-23 | 2020-21 | 2021-22 | 2022-23 | 2020-21 | 2021-22 | 2022-23 | |
| General public services | |||||||||
| Public and common services | 15,188 | 24,566 | 23,878 | 3,244 | 3,542 | 2,918 | 18,432 | 28,108 | 26,796 |
| International services | 9,059 | 6,801 | 6,742 | 2,167 | 1,560 | 1,730 | 11,226 | 8,361 | 8,472 |
| Public sector interest expenditure | 42,240 | 74,515 | 128,398 | 0 | 0 | 0 | 42,240 | 74,515 | 128,398 |
| Defence | 32,247 | 32,959 | 33,488 | 12,335 | 15,707 | 22,020 | 44,582 | 48,666 | 55,508 |
| Public order and safety | 35,893 | 36,733 | 40,512 | 2,996 | 3,036 | 3,403 | 38,889 | 39,769 | 43,915 |
| Economic affairs | |||||||||
| Enterprise and economic development | 108,968 | 37,968 | 58,534 | 22,313 | -1,100 | 5,288 | 131,281 | 36,868 | 63,823 |
| Science and technology | 204 | 354 | 296 | 6,395 | 6,235 | 6,866 | 6,599 | 6,589 | 7,162 |
| Employment policies | 2,543 | 4,098 | 3,745 | 77 | 124 | 74 | 2,620 | 4,222 | 3,819 |
| Agriculture, forestry and fisheries | 5,800 | 5,261 | 5,576 | 519 | 760 | 1,087 | 6,319 | 6,021 | 6,663 |
| Transport | 26,478 | 19,070 | 16,268 | 22,904 | 25,611 | 27,908 | 49,382 | 44,681 | 44,177 |
| Environment protection | 8,519 | 9,040 | 8,440 | 4,435 | 4,722 | 5,442 | 12,954 | 13,762 | 13,883 |
| Housing and community amenities | 3,811 | 3,474 | 3,651 | 9,879 | 11,745 | 14,137 | 13,690 | 15,219 | 17,788 |
| Health | 204,991 | 206,623 | 200,394 | 13,576 | 9,613 | 11,169 | 218,567 | 216,236 | 211,564 |
| Recreation, culture and religion | 10,684 | 10,552 | 10,823 | 2,086 | 2,374 | 3,180 | 12,770 | 12,926 | 14,004 |
| Education and training | 86,215 | 90,927 | 95,412 | 9,309 | 9,200 | 10,127 | 95,524 | 100,127 | 105,538 |
| Social protection | 298,678 | 299,174 | 318,007 | 639 | 861 | 766 | 299,317 | 300,035 | 318,773 |
| EU Transactions | 6,988 | -2,005 | -2,274 | 6,988 | -2,005 | -2,274 | |||
| Accounting adjustments | 82,549 | 77,650 | 90,443 | 12,800 | 9,715 | -3,520 | 95,349 | 87,365 | 86,923 |
| Total | 981,055 | 937,760 | 1,042,334 | 125,674 | 103,705 | 112,596 | 1,106,729 | 1,041,465 | 1,154,930 |
| Devolved expenditure | Reserved expenditure | Total | |||||||
|---|---|---|---|---|---|---|---|---|---|
| 2020-21 | 2021-22 | 2022-23 | 2020-21 | 2021-22 | 2022-23 | 2020-21 | 2021-22 | 2022-23 | |
| General public services | |||||||||
| Public and common services | 1,390 | 1,619 | 1,797 | 717 | 1,508 | 1,479 | 2,106 | 3,127 | 3,276 |
| International services | 1 | 5 | 1 | 915 | 684 | 693 | 916 | 689 | 694 |
| Public sector interest expenditure | 1,908 | 1,732 | 1,751 | 2,164 | 4,775 | 9,169 | 4,071 | 6,507 | 10,920 |
| Defence | 6 | 3 | 4 | 3,621 | 3,971 | 4,536 | 3,627 | 3,974 | 4,540 |
| Public order and safety | 3,029 | 3,249 | 3,472 | 368 | 320 | 409 | 3,397 | 3,568 | 3,881 |
| Economic affairs | 0 | 0 | 0 | 0 | 0 | 0 | 0 | 0 | 0 |
| Enterprise and economic development | 3,135 | 1,912 | 1,232 | 8,364 | 2,181 | 4,850 | 11,499 | 4,093 | 6,082 |
| Science and technology | 1 | 1 | 3 | 604 | 619 | 651 | 604 | 620 | 654 |
| Employment policies | 0 | 0 | 0 | 197 | 326 | 290 | 197 | 326 | 290 |
| Agriculture, forestry and fisheries | 904 | 825 | 843 | 13 | 76 | 79 | 917 | 901 | 922 |
| Transport | 3,408 | 3,455 | 3,558 | 1,192 | 1,155 | 1,339 | 4,600 | 4,610 | 4,897 |
| Environment protection | 1,174 | 1,138 | 1,232 | 312 | 342 | 305 | 1,486 | 1,480 | 1,537 |
| Housing and community amenities | 2,086 | 2,457 | 2,766 | 0 | 0 | 0 | 2,087 | 2,457 | 2,766 |
| Health | 16,973 | 17,538 | 16,671 | 1,194 | 1,651 | 943 | 18,167 | 19,189 | 17,615 |
| Recreation, culture and religion | 1,115 | 1,176 | 1,095 | 356 | 391 | 452 | 1,471 | 1,568 | 1,547 |
| Education and training | 10,052 | 10,282 | 10,032 | 13 | 12 | 14 | 10,066 | 10,294 | 10,046 |
| Social protection | 8,789 | 9,083 | 10,395 | 17,308 | 17,288 | 18,916 | 26,097 | 26,371 | 29,311 |
| EU Transactions | 0 | 0 | 0 | 686 | -162 | -186 | 686 | -162 | -186 |
| Accounting adjustments | 6,838 | 7,290 | 7,979 | 1,444 | 478 | -137 | 8,282 | 7,768 | 7,843 |
| Total | 60,809 | 61,765 | 62,831 | 39,466 | 35,615 | 43,804 | 100,275 | 97,380 | 106,635 |
| Devolved expenditure | Reserved expenditure | Total | |||||||
|---|---|---|---|---|---|---|---|---|---|
| 2020-21 | 2021-22 | 2022-23 | 2020-21 | 2021-22 | 2022-23 | 2020-21 | 2021-22 | 2022-23 | |
| General public services | |||||||||
| Public and common services | 1,176 | 1,380 | 1,524 | 606 | 1,380 | 1,370 | 1,782 | 2,760 | 2,895 |
| International services | 1 | 5 | 1 | 738 | 556 | 552 | 739 | 561 | 553 |
| Public sector interest expenditure | 1,908 | 1,732 | 1,751 | 2,164 | 4,775 | 9,169 | 4,071 | 6,507 | 10,920 |
| Defence | 6 | 3 | 4 | 2,616 | 2,686 | 2,734 | 2,622 | 2,689 | 2,738 |
| Public order and safety | 2,850 | 3,063 | 3,283 | 321 | 279 | 360 | 3,170 | 3,341 | 3,643 |
| Economic affairs | |||||||||
| Enterprise and economic development | 2,657 | 1,373 | 644 | 7,140 | 2,328 | 4,619 | 9,797 | 3,701 | 5,263 |
| Science and technology | 1 | 1 | 3 | 15 | 43 | 22 | 15 | 44 | 24 |
| Employment policies | 0 | 0 | 0 | 191 | 316 | 285 | 191 | 316 | 285 |
| Agriculture, forestry and fisheries | 785 | 683 | 687 | 14 | 72 | 74 | 799 | 755 | 762 |
| Transport | 2,071 | 1,890 | 1,666 | 567 | 535 | 476 | 2,637 | 2,425 | 2,143 |
| Environment protection | 862 | 864 | 910 | 91 | 116 | 55 | 952 | 980 | 966 |
| Housing and community amenities | 216 | 157 | 276 | 0 | 0 | 0 | 216 | 157 | 276 |
| Health | 16,519 | 16,774 | 15,796 | 998 | 1,692 | 928 | 17,516 | 18,466 | 16,724 |
| Recreation, culture and religion | 954 | 944 | 873 | 313 | 345 | 374 | 1,267 | 1,289 | 1,247 |
| Education and training | 8,934 | 9,213 | 8,997 | 13 | 13 | 14 | 8,947 | 9,225 | 9,011 |
| Social protection | 8,681 | 8,932 | 10,239 | 17,290 | 17,260 | 18,908 | 25,971 | 26,192 | 29,147 |
| EU transactions | 0 | 0 | 0 | 686 | -162 | -186 | 686 | -162 | -186 |
| Accounting adjustments | 6,356 | 6,863 | 7,532 | 1,496 | 702 | 1,187 | 7,852 | 7,565 | 8,720 |
| Total | 53,975 | 53,877 | 54,189 | 35,257 | 32,936 | 40,941 | 89,232 | 86,813 | 95,129 |
| Devolved expenditure | Reserved expenditure | Total | |||||||
|---|---|---|---|---|---|---|---|---|---|
| 2020-21 | 2021-22 | 2022-23 | 2020-21 | 2021-22 | 2022-23 | 2020-21 | 2021-22 | 2022-23 | |
| General public services | |||||||||
| Public and common services | 214 | 239 | 273 | 110 | 128 | 109 | 324 | 367 | 382 |
| International services | 0 | 0 | 0 | 177 | 128 | 142 | 177 | 128 | 142 |
| Public sector interest expenditure | 0 | 0 | 0 | 0 | 0 | 0 | 0 | 0 | 0 |
| Defence | 0 | 0 | 0 | 1,005 | 1,285 | 1,802 | 1,005 | 1,285 | 1,802 |
| Public order and safety | 179 | 186 | 189 | 47 | 41 | 49 | 227 | 227 | 238 |
| Economic affairs | 0 | 0 | 0 | 0 | 0 | 0 | 0 | 0 | 0 |
| Enterprise and economic development | 478 | 539 | 587 | 1,224 | -147 | 231 | 1,702 | 391 | 819 |
| Science and technology | 0 | 0 | 0 | 589 | 575 | 630 | 589 | 575 | 630 |
| Employment policies | 0 | 0 | 0 | 6 | 10 | 5 | 6 | 10 | 5 |
| Agriculture, forestry and fisheries | 119 | 142 | 156 | 0 | 4 | 5 | 118 | 146 | 161 |
| Transport | 1,338 | 1,565 | 1,892 | 625 | 620 | 862 | 1,963 | 2,185 | 2,754 |
| Environment protection | 313 | 274 | 321 | 221 | 226 | 250 | 534 | 500 | 571 |
| Housing and community amenities | 1,870 | 2,300 | 2,490 | 0 | 0 | 0 | 1,870 | 2,300 | 2,490 |
| Health | 455 | 764 | 875 | 196 | -42 | 16 | 650 | 723 | 891 |
| Recreation, culture and religion | 161 | 232 | 222 | 43 | 46 | 78 | 204 | 279 | 300 |
| Education and training | 1,118 | 1,069 | 1,036 | 0 | 0 | 0 | 1,118 | 1,069 | 1,036 |
| Social protection | 108 | 150 | 155 | 18 | 29 | 9 | 126 | 179 | 164 |
| EU transactions | 0 | 0 | 0 | 0 | 0 | 0 | 0 | 0 | 0 |
| Accounting adjustments | 482 | 427 | 447 | -52 | -224 | -1,324 | 430 | 203 | -877 |
| Total | 6,834 | 7,888 | 8,643 | 4,209 | 2,680 | 2,864 | 11,043 | 10,567 | 11,506 |
Scotland’s Notional Contributions to the European Union Budget
While a member of the European Union (EU), the UK contributed to the EU budget and received funding from the EU via a number of programmes. Although the UK left the EU on 31 January 2020, it continued to make payments to, and receive funding from, the EU in 2020-21 under transitional arrangements. These transactions largely ended in 2021-22, although it continues to receive funding for programmes funded under the 2013-2020 Multiannual Financial Framework.
As per the Withdrawal Agreement, the UK continues to makes payments for its outstanding commitments through the EU Financial Settlement. However, in these payments are not scored as EU transactions, but instead are classed as spending on public and common services. Scotland is allocated a population share of this spending in GERS, and this is reflected in an increase in Other UK Government current expenditure on public and common services in Table 3.8.
Further details on the EU Financial Settlement are available from: Brexit: the financial settlement - a summary - House of Commons Library (parliament.uk)
Scotland did not contribute directly to the EU budget. In GERS, Scotland is assigned an estimated share of the UK contribution. In contrast, Scotland received funding directly from the EU, through the Common Agricultural Policy, European Structural Funds, and European Regional Development Funding. Actual amounts are used for these items.
The EU Transactions lines in the GERS tables are produced on a National Accounts basis, and exclude traditional own resource payments. These are payments collected by the UK on behalf of the EU, and therefore are excluded from the UK Public Sector Finances. However, they are normally included when reporting on the UK’s net contribution to EU budgets. Table 3.9 shows net payments to the EU including these contributions.
Funding the EU Budget
There are three key sources of funding for the EU, which come from each member state:[24]
- Traditional own resource (TOR) - Agriculture duties and customs duties levied on agriculture and non-agriculture products from outside the EU
- VAT based own resource – Calculated as a percentage of countries’ VAT tax base.
- Gross National Income (GNI) based own resource – Calculated as a percentage of countries’ GNI. This is the EU’s single largest source of revenue.
Since 1985, the UK received a rebate on its contribution, broadly equal to 66% of its net contribution in the previous year. Scotland is apportioned a population share of the rebate.
Net Contribution to the EU
The UK’s net contribution to the EU is calculated as the difference between the UK’s gross contribution to the EU budget (less the rebate) and public sector EU receipts.
The table below sets out these transactions for Scotland and the UK.
| Scotland | UK | |||||
|---|---|---|---|---|---|---|
| 2020-21 | 2021-22 | 2022-23 | 2020-21 | 2021-22 | 2022-23 | |
| GNI based contribution | 1,026 | 11 | 4 | 12,762 | 139 | 46 |
| UK abatement | -308 | 15 | -35 | -3,785 | 181 | -428 |
| VAT-based contribution | 159 | -0 | - | 1,954 | -4 | 0 |
| Expenditure transfers to the EU | 876 | 26 | -31 | 10,930 | 315 | -383 |
| Receipts to cover collection costs of TOR | -48 | -1 | -1 | -536 | -12 | -12 |
| TOR | 220 | 4 | 4 | 2,695 | 49 | 50 |
| EU Financial Settlement (EUFS) net payments | -20 | 635 | 731 | -249 | 7,758 | 8,939 |
| Gross contribution to the EU budget | 1,028 | 664 | 703 | 12,840 | 8,110 | 8,594 |
| Public sector EU receipts | -143 | -187 | -154 | -3,406 | -2,308 | -1,879 |
| Net contributions to the EU budget | 885 | 477 | 549 | 9,434 | 5,802 | 6,715 |
| EU transactions (net contributions to EU institutions less TOR and EUFS) | 686 | -162 | -186 | 6,988 | -2,005 | -2,274 |
Private Finance Initiative and Non-Profit Distributing Financing support for Public Private Partnerships (PPPs)
Public Private Partnerships (PPPs) are long-term contracts for services that include the provision of associated facilities or properties. Under the contract, the private sector is generally responsible for various roles, including designing and constructing a building or facility, and maintaining and servicing it throughout the contract term. The public sector retains accountability for the main public services. The private sector is responsible for financing the project up front and only receives payment from the public sector once construction has been completed and the services have commenced. These payments are reflected in the GERS expenditure figures, but typically broader payments associated with these schemes, such as the upfront capital investment, is not included, although it will be reflected in the total unitary charge payments over the lifetime of the scheme.
Previous GERS publications have provided a breakdown of payments related to PPPs in Scotland. Supporting documents - Government Expenditure & Revenue Scotland (GERS) 2021-22 - gov.scot (www.gov.scot)
Contact
Email: economic.statistics@gov.scot
There is a problem
Thanks for your feedback