Government Expenditure and Revenue Scotland 2022-23
Government Expenditure and Revenue Scotland (GERS) is a National Statistics publication. It estimates the revenue raised in Scotland and the cost of public services provided for the benefit of Scotland.
This document is part of a collection
Chapter 2: North Sea Revenue
Introduction
In GERS, the term North Sea is used to refer to all offshore oil and gas activity. North Sea revenue in GERS comes from four sources: petroleum revenue tax, corporation tax, licence fees, and the new Energy Profits Levy.
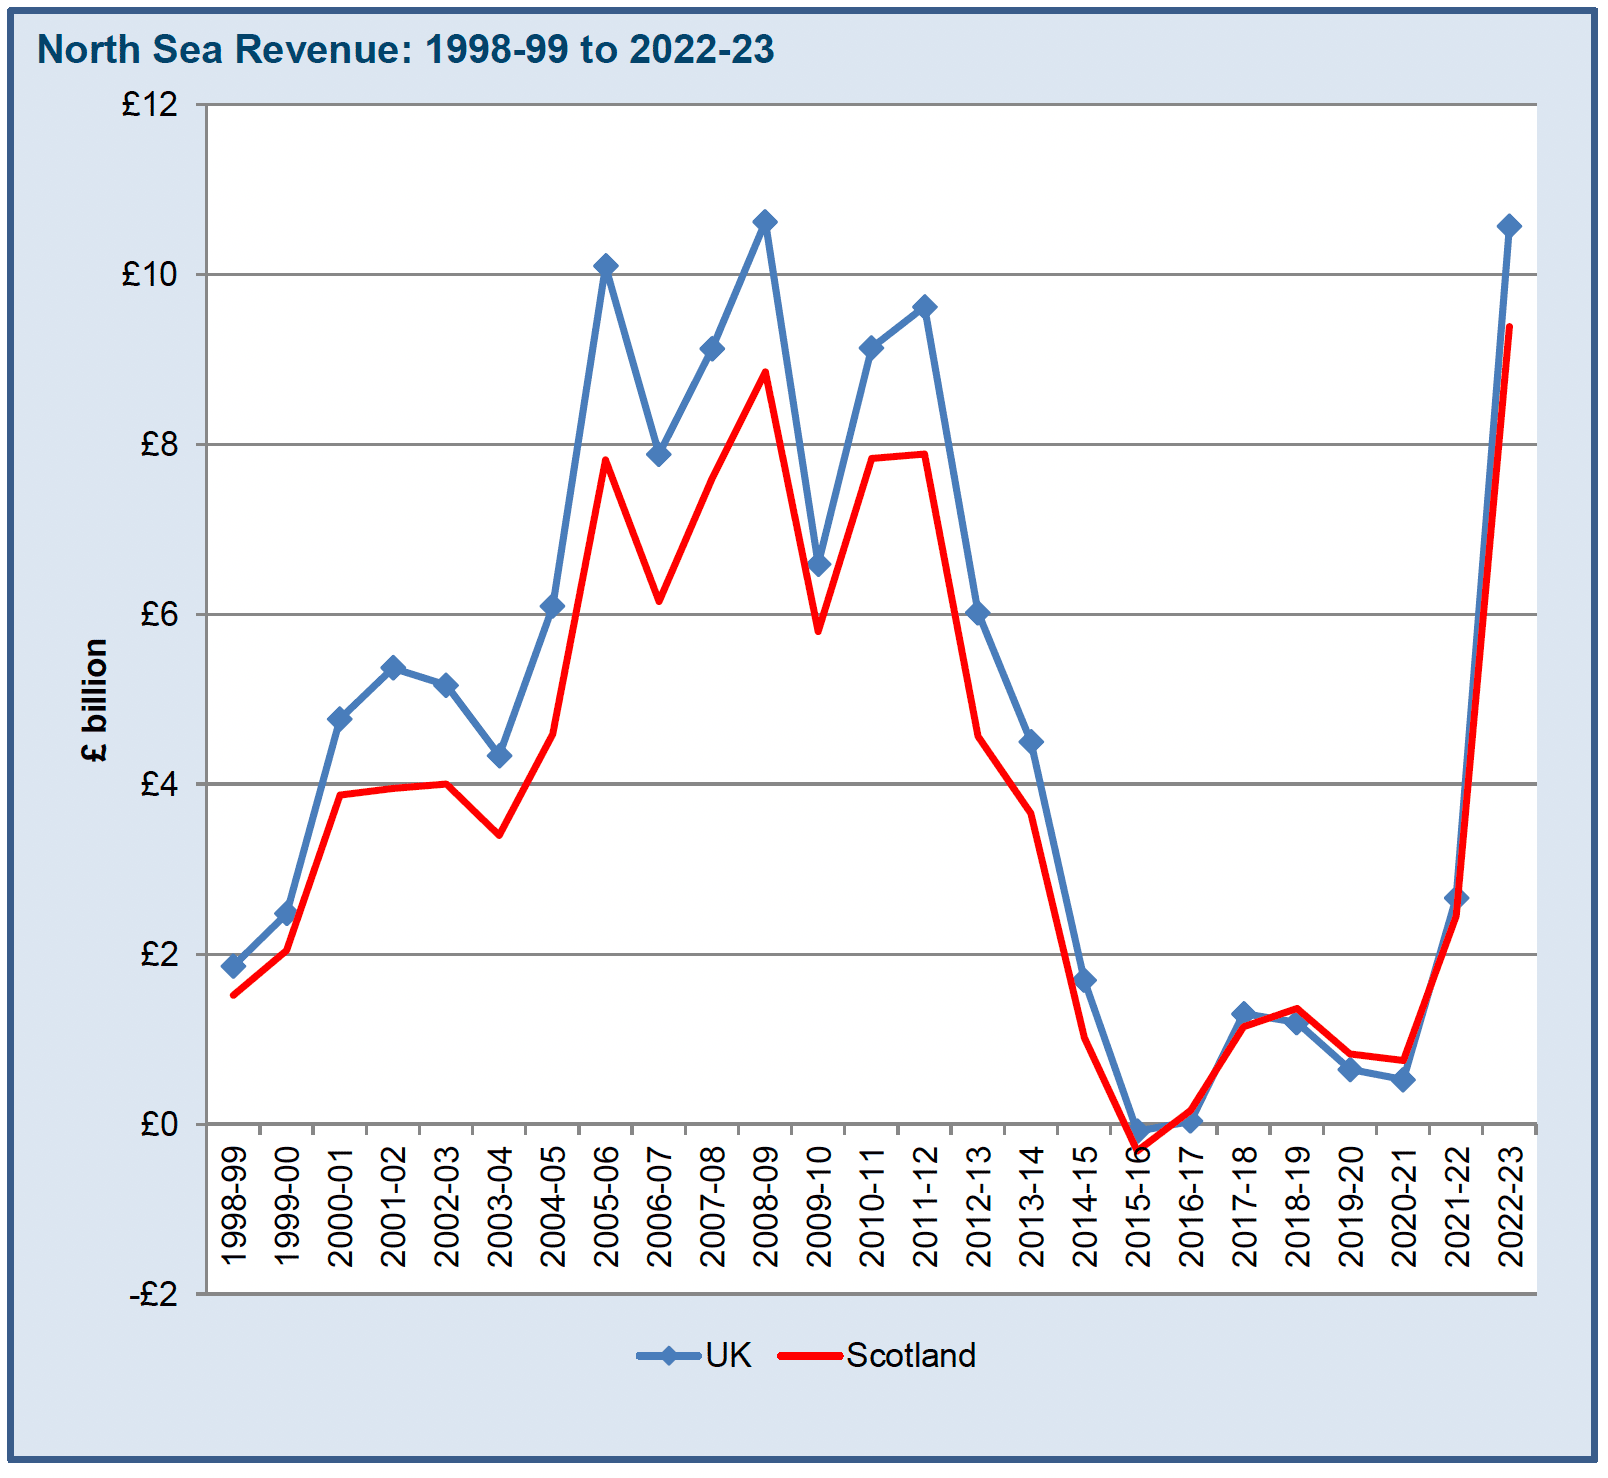
Table 2.1 shows the revenue raised from each component of North Sea revenue since 2020-21. Having been £522 million in 2020-21, UK North Sea revenue increased in 2021-22 and has seen a further significant increase in 2022-23, reaching £10.6 billion, its highest level ever. This reflects the impact of higher oil and gas prices on corporation tax receipts, and the introduction of the Energy Profits Levy from 26 May 2022.
| £ million | |||
|---|---|---|---|
| 2020-21 | 2021-22 | 2022-23 | |
| Licence fees | 72 | 72 | 72 |
| North Sea corporation tax | 691 | 3,142 | 6,150 |
| Petroleum revenue tax | -241 | -552 | -234 |
| Energy Profits Levy | - | - | 4,582 |
| Total | 522 | 2,662 | 10,570 |
North Sea revenue is subject to annual fluctuations and is driven by a number of factors, including the oil price, the sterling dollar exchange rate, production, operating expenditure, capital investment, and the prevailing fiscal regime.
Oil and gas prices fell across 2022-23, although remained higher than pre-pandemic levels. The oil price fell from $105 per barrel in April 2022 to $78 in March 2023, whilst gas prices fell from 305p per therm to 118p. These falls reflected markets continuing to adjust to changes in supply and demand after the Russian invasion of Ukraine and the ongoing recovery from the pandemic.[15] [16]
Overall North Sea production of oil and gas increased by 2% in 2022 to 78 million tons of oil equivalent.[17] This was driven by increases in production of gas, which rose by 16%, whilst oil production continued to decline, falling by 8%.
In 2022 total expenditure on the UK Continental Shelf increased by 19% in real terms compared to 2021, to stand at £14.6 billion. The increase was primarily due to an increase in capital expenditure and operating costs, which increased by 24% an 11% respectively in real terms. There were also large increases in exploration and appraisal (E&A) and decommissioning expenditure, which both increased by over 40%, although these are still a relatively small part of overall expenditure, together accounting for around 15% of total spend.[18]
The UK fiscal regime in 2022-23 consisted of offshore Ring Fence Corporation Tax (RFCT) at 30%, Petroleum Revenue Tax (PRT) at 0% and a Supplementary Charge (SC) of 10%.[19] On 26 May 2022, the UK Government introduced a new Energy Profits Levy, which is an additional 35% tax on UK oil and gas profits on top of the existing taxes, taking the combined rate of tax on profits to 75%.[20]
As shown in Table 2.1, PRT receipts are negative. This reflects the fact that, although companies no longer pay PRT, they can still claim refunds on PRT paid in previous years against current trading losses and decommissioning spending. As a result, PRT receipts will only be negative in the future under the current tax regime.[21]
Scotland’s Share of North Sea Revenue
In the ONS’s Regional Accounts, the UK continental shelf is not allocated to specific geographic regions, but is considered a separate region of the UK (the extra-regio territory). As such, an assumption as to Scotland’s share of the North Sea needs to be made in GERS.
Two estimates of Scotland’s share of North Sea revenue are shown in GERS:
- An illustrative geographical share
- A population share
These are discussed below.
An Illustrative Geographical Share
The most common approach to estimating North Sea revenue is to apportion a share of North Sea revenue to Scotland on the geographical location of oil and gas fields. In order to estimate this share, GERS uses the share reported in the ONS Country and Regional Public Sector Finances publication. The estimate is based on the median line principle as employed in 1999 to determine the boundary between Scotland and the rest of the UK for fishery demarcation purposes. Other alternatives are possible. Production, costs and revenue are allocated on a field-by-field basis to either the rest of the UK or Scotland using this boundary.
Table 2.2 shows Scotland’s illustrative geographical share of UK North Sea revenue, broken down by licence fees, corporation tax, and petroleum revenue tax. In 2020‑21, Scotland’s illustrative geographical share of North Sea revenues is above 100%, which had been the case since 2018-19. This reflects the fact that the tax corporation tax refunds are estimated to be disproportionately paid out in non‑Scottish waters.
Following the rise in oil and gas prices in 2021-22, there has been a significant increase in North Sea corporation tax receipts, which reduces the importance of tax refunds in overall receipts. This has led to Scotland’s share of corporation tax receipts falling back to below 100%.
| £ million | |||
|---|---|---|---|
| 2020-21 | 2021-22 | 2022-23 | |
| UK revenue | 522 | 2,662 | 10,570 |
| Licence fees | 72 | 72 | 72 |
| North Sea corporation tax | 691 | 3,142 | 6,150 |
| Petroleum revenue tax | -241 | -552 | -234 |
| Energy Profits Levy | - | - | 4,582 |
| Scottish geographical revenue | 752 | 2,446 | 9,386 |
| Licence fees | 84 | 63 | 63 |
| North Sea corporation tax | 799 | 2,696 | 5,391 |
| Petroleum revenue tax | -131 | -313 | -133 |
| Energy Profits Levy | - | - | 4,064 |
| Scottish share of UK | 144.1% | 91.9% | 88.8% |
| Licence fees | 117.0% | 88.0% | 88.0% |
| North Sea corporation tax | 115.6% | 85.8% | 87.7% |
| Petroleum revenue tax | 54.2% | 56.8% | 56.6% |
| Energy Profits Levy | - | - | 88.7% |
Scotland’s estimated geographical share of the North Sea sector, used in this report, is highlighted in the figure below.
UK Continental Shelf and Scottish Boundary
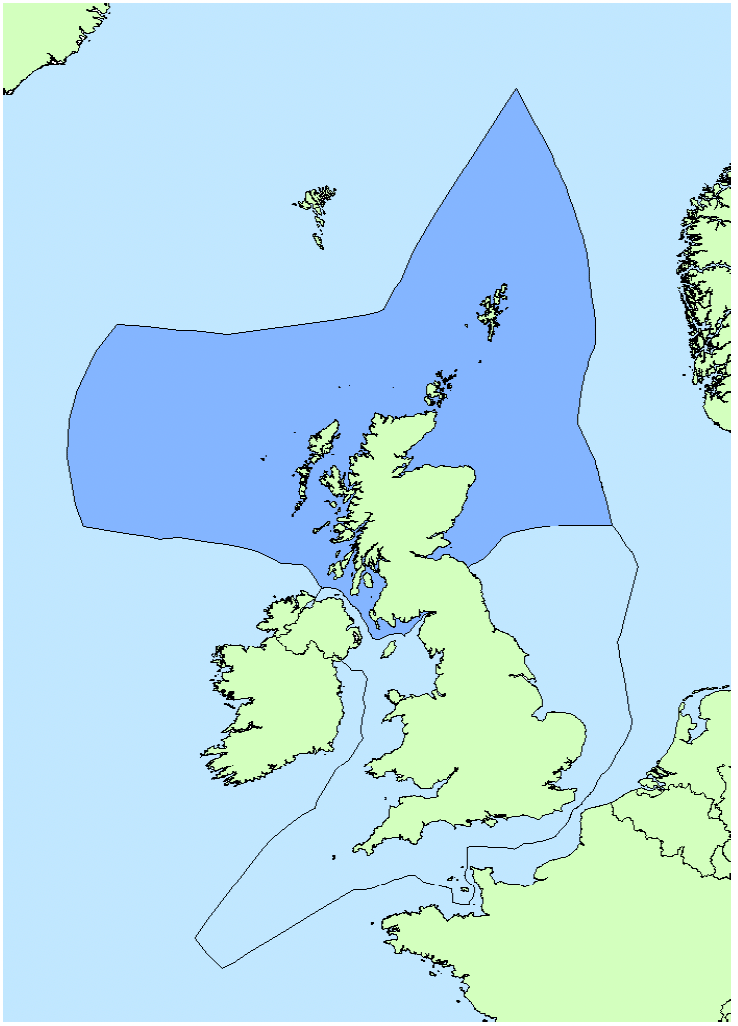
Source: Scottish Government
Population Share
An alternative approach to North Sea revenue is to view it as a non-identifiable UK revenue, in which case a population share may be apportioned to Scotland. Table 2.2 provides an estimate of Scotland’s share of North Sea revenue under this approach.
| £ million | |||
|---|---|---|---|
| 2020-21 | 2021-22 | 2022-23 | |
| Total North Sea revenue | 522 | 2,662 | 10,570 |
| Scotland’s population share | 43 | 218 | 865 |
| Scotland’s share of North Sea revenue (%) | 8.2% | 8.2% | 8.2% |
Contact
Email: economic.statistics@gov.scot
There is a problem
Thanks for your feedback