Scottish Economic Statistics 2008
This is the ninth edition of the annual publication Scottish Economic Statistics, which is produced by statisticians in the Scottish Government.
B2 chapter two: Enterprises
Introduction
This chapter presents data on Scottish business stock and innovation activity. The first section provides an analysis of the Scottish Corporate Sector which is based on a March 2008 extract of the Inter Departmental Business Register ( IDBR).
Structure of the Economy
The total number of public and private enterprises active in Scotland in March 2008 was 282,330. The associated employment and turnover of these enterprises was 2.5 million and £243 billion respectively. Table 2.A shows a breakdown of these figures by legal status.
Table 2.A: Legal status of enterprises in Scotland, 2008
Legal Status |
Number of enterprises |
Total Scottish employment |
|---|---|---|
Companies (incl. Building Societies) |
71,310 |
1,323,010 |
Sole proprietors |
47,135 |
131,730 |
Partnerships |
28,410 |
169,650 |
Public Corporation/nationalised body |
35 |
25,590 |
Central and local government |
205 |
588,580 |
Non-profit making bodies and mutual associations |
7,750 |
157,570 |
Total registered 1 |
154,840 |
2,396,130 |
Unregistered enterprises |
127,490 |
145,620 |
Total |
282,330 |
2,541,750 |
Source: Scottish Government, ONS ( IDBR)
Note: Totals may not equal the sum of the constituent parts due to rounding.
1 Registered for VAT and/or PAYE
Private Sector
The estimated number of enterprises in the private sector in Scotland (excluding central and local government) was 282,125 in March 2008 (up 0.9% since 2007) ( Table 2.1). The associated employment and turnover of these enterprises was 1.95 million and £225 billion respectively.
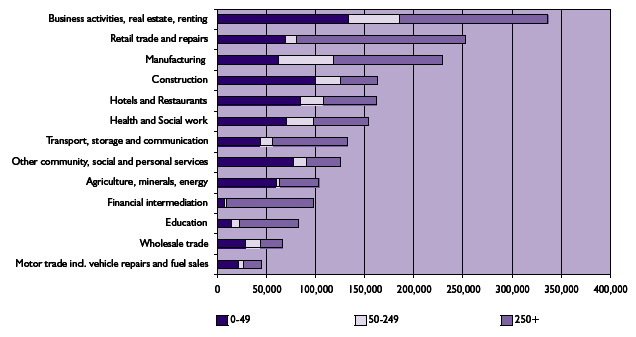
The sector with the highest proportion of all enterprises was the 'Business Activities, Real Estate and Renting' sector (18%) followed by the 'Construction' sector (17%). The sector with smallest proportion of all enterprises was 'Financial Intermediation' (1%) ( Table 2.2a). The 'Business Activities, Real Estate and Renting' sector also had the most employment in 2008 (17%) followed by the 'Retail trade and repairs sector' (13%) and the Manufacturing sector (12%) ( Table 2.2b). The 'Mining, Quarrying, and Utilities' sector generated the greatest proportion of turnover (19%) ( Table 2.2c). Chart 2.1 shows employment by employee size band for each industry group.
Chart 2.1: Employment in small, medium and large enterprises, by industry group, 2008
Source: Scottish Government, ONS ( IDBR)
Registered Enterprises
The figures above relate to all enterprises operating in Scotland. This includes registered enterprises ( i.e. those registered for VAT and/or PAYE) and unregistered enterprises (enterprises with no employees, estimated from a combination of surveys). Information on the location of enterprises is, however, only available for registered firms, and Table 2.3 shows the location of the registered enterprises by Local Authority area. The areas with the most registered enterprises and employment were Glasgow City (11% of enterprises and 16% of employment) and the City of Edinburgh (10% of enterprises and 13% of employment).
Box 2.1 Introduction of a new Standard Industrial Classification system ( SIC 2007) The UK Standard Industrial Classification of Economic Activities ( SIC) was first introduced into the United Kingdom in 1948 for use in classifying business establishments and other statistical units by the type of economic activity in which they are engaged. The classification provides a framework for the collection, tabulation, presentation and analysis of data and its use promotes uniformity across business and economic statistics. The introduction of SIC 2007 represents the first major revision of the Standard Industrial Classification system since 1992. These revisions are motivated by the need to adapt the classifications to changes in the world economy. The revised classifications reflect the growing importance of service activities in the economies over the last fifteen years, mainly due to the developments in information and communications technologies ( ICT). The SIC is a hierarchical five digit system. SIC 2007 is divided into 21 sections, each denoted by a single letter from A to U. The letters of the sections can be uniquely defined by the next breakdown, the divisions (denoted by two digits). The divisions are then broken down into groups (3 digits), then into classes (4 digits) and, in several cases, again into subclasses (5 digits). So for example we have: Section C - Manufacturing (comprising divisions 10 to 33) Division 13 - Manufacture of textiles Group 13.9 - Manufacture of other textiles Class 13.93 - Manufacture of carpets and rugs Subclass 13.93/1 - Manufacture of woven or tufted carpets and rugs Full details of the SIC 2007 structure are available at the following web address: http://www.statistics.gov.uk/methods_quality/sic/downloads/SIC2007explanatorynotes.pdf. The introduction of SIC 2007 is a fundamental change to the existing classification system and the areas which have been affected most include 'Business Activities', 'Retail Sale of Automotive Fuel', 'Recycling', and 'Manufacturing'. There are a number of new categories, the majority of which relate to service activities: for example, there are almost three times as many divisions for 'Real estate, professional and administrative' service activities under SIC 2007 as under SIC 2003. Also, the expansion of ICT activities is well reflected in the new Section J 'Information and Communication', which includes 'publishing', 'film and broadcasting activities' and 'news agencies', in addition to 'telecommunication' and 'computer related activities'. The SIC 2007 changes came into effect on the 1st January 2008 with all units on the Office for National Statistics' business register dual coded to SIC 2003 and SIC 2007. The table below outlines when the main Scottish Government outputs will be published using SIC 2007: Table 1: SIC 2007 Implementation Timetable for Scottish Government Outputs
For more information on the implementation of SIC 2007 within the Scottish Government please email industrystatistics@scotland.gsi.gov.uk. |
VAT Statistics
Statistics on VAT registrations and de-registrations, as well as the start-of-year stocks of all VAT registered businesses, are released annually by the Department for Business Enterprise and Regulatory Reform ( BERR). 1 This is a useful secondary source for data on Scottish businesses as it allows direct comparison with the UK and other regions. The data do not provide a complete picture of business activity as only companies with an annual turnover of £61,000 or more ( VAT threshold for 2006-07), are required to register for VAT. The figures consequently exclude around half of all firms.
It is important to note that the BERR data differ from the Scottish Government Corporate Sector statistics because they only include enterprises who have their headquarters in Scotland and who are registered for VAT. The Scottish Government figures additionally include enterprises which are based outside Scotland but have business units in Scotland, and also those enterprises which are not registered for VAT but are registered for PAYE.
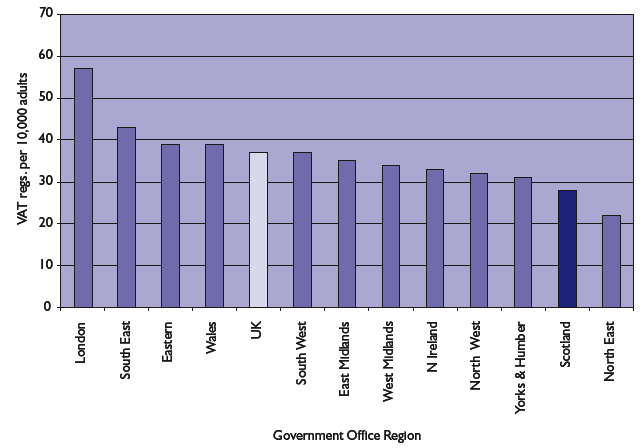
Although the stock of VAT registered enterprises has increased steadily since 1997, Scotland has one of the lowest VAT registration rates of all the UK regions (Chart 2.2).
Chart 2.2: VAT Registrations per 10,000 resident adults by Government Office Region/Country 2006
Source: Department for Business Enterprise & Regulatory Reform
Business Registrations and De-registrations
The BERR statistics on VAT registrations and de-registrations are the best official source for estimating business start-ups and closures. However, it should be noted that the number of business de-registrations is not a direct measure for the number of business "failures". Businesses can de-register for VAT for a number of reasons, e.g. de-registration could be associated with a merger with another firm to form a new business.
Increasing the business start-up rate in Scotland is one of 45 National Indicators used to monitor how the Scottish Government is progressing towards achieving its National Outcomes. The VAT registration rate (per 10,000 resident adults) is used to measure this indicator as it provides a sign of new firm formation and entrepreneurship, and gives an indication of how conducive the business environment is for encouraging new ventures and increased demand for businesses.
The number of business start-ups in Scotland is relatively stable and has been for the last ten years. The latest figures 2 show 28 registrations per 10,000 population in 2006, which was the same level as 2005.
Table 2.4 shows the stock of enterprises, new registrations and de-registrations, along with per head figures to allow comparisons across areas. Scotland has a lower rate of both registrations and de-registrations (28 and 22 per 10,000 population respectively) compared to the UK (37 and 29 per 10,000 population respectively). However, these rates vary across Scotland. For example, Aberdeenshire, Stirling, and Highland all have registration and de-registration rates that are well above the average for Scotland. Meanwhile, West Dunbartonshire and Dundee City have registration and de-registration rates that are well below the Scottish average. This is reflected by the business stock figures; of all the mainland Local Authorities, business density ( VAT registered stocks per 10,000 population) is highest in Aberdeenshire and Highland, and low in both West Dunbartonshire and Dundee City. This highlights the correlation between the level of registration and de-registration and business density.
Business Survival Rates
Business survival rates can be calculated using the BERRVAT statistics and are published every two years. The survival rate is the proportion of businesses that register for VAT in a given year that have not de-registered within a certain timescale. Businesses that are registered for VAT can be tracked from the time they first register until the time that they notify HM Revenues & Customs that they have ceased trading or that their turnover has fallen below the VAT threshold. The turnover threshold for VAT registration in November 1995 was £47,000, rising each year to £60,000 in April 2005.
Table 2.5 shows the survival rates in Scotland up to 10 years after registration. These figures suggest that since 1995, survival rates in Scotland have been rising, despite levelling off in recent years. For example, of all the businesses who registered in 1995, 88.5 per cent were still registered one year later. This one year survival figure had risen to 91.4 per cent by 2004.
Innovation in Scottish Industry
Introduction
Innovation is central to productivity and competitiveness and is a key factor in the growth of the Scottish Economy. For any business, innovation is crucial to maintaining profitability, meeting competition and providing customers with high value products and services. Such innovation activity is broad, extending beyond the development of new technology and knowledge, to include the dissemination and use of such knowledge, and the improvement of organisation and management strategies. The remainder of this chapter considers Scotland's performance across the different aspects of innovation, including:
- Research and development
- Innovative products and processes
- Commercialisation of academic knowledge
- Patents
- Use of e-commerce
Research and Development
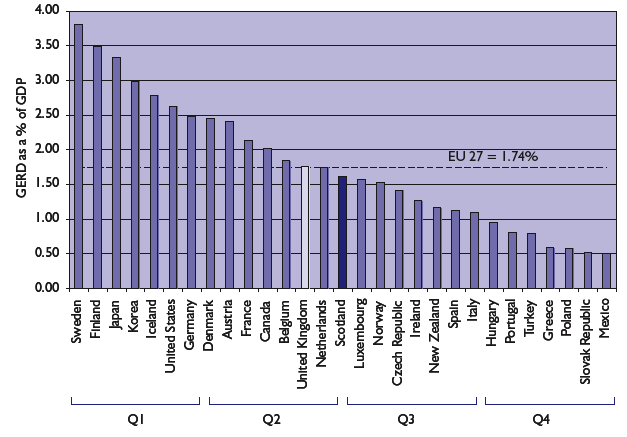
Gross Expenditure on Research and Development ( GERD) is comprised of R&D undertaken by the business, government and higher education sectors. The latest data for 2005 found that Scottish GERD was £1,582 million, which is 7.5 per cent of the total UK figure and represented 1.61 per cent of Scottish GDP, compared to 1.76 per cent in the UK. Looking at GERD on an international level, Scottish GERD as a percentage of GDP is in the third quartile of OECD countries, as illustrated in Chart 2.3. Additionally shown in Chart 2.3 is the EU 27 mean GERD expenditure which is 1.74 per cent of GDP. Scottish GERD falls below this level by 0.13 per cent. The importance of R&D is recognised by the government's National Indicator on GERD, with a target to at least halve the gap between Scottish and EUGERD as a percentage of GDP by 2011. Further information on this target can be found on the Scotland Performs website. 3
Chart 2.3: GERD as a % of GDP for Scotland and OECD countries that reported in 2005
Source: Scottish Government, OECD ( MSTI 2008/1)
Business Enterprise Research and Development ( BERD) expenditure is measured annually through an Office of National Statistics ( ONS) survey. The ONS publishes BERD figures annually and are due to publish the 2007 data in early 2009. With each new release of data, back figures are often subject to some revision, and therefore the following figures may be subject to change. The most recent survey in 2006, 4 found that BERD expenditure in Scotland was £579 million, which represents 4 per cent of the UK total. Expenditure decreased from £586 million in the previous year (a 4% decrease in real terms). Compared to the size of Scotland's economy, BERD expenditure is relatively low, reaching only 0.56 per cent of GDP, nearly half of the UK equivalent figure (1.08%). When the level of Scottish BERD is compared to the other regions of the UK it lies in the third quartile. The level of business R&D in Scotland is also relatively low when compared to the OECD average, as illustrated in Table 2.6.
R&D expenditure is analysed by the product that benefits from the research, thus ensuring that R&D contracted out is allocated to the final product. This is different to the analysis by industrial sector used elsewhere in this publication. Table 2.7 shows how expenditure for broad product groups has changed over time. Three quarters of R&D undertaken by businesses in Scotland was funded by UK businesses. The largest companies (400 employees and over) accounted for 75 per cent of BERD expenditure, while companies employing 100 to 399 employees accounted for a further 12 per cent. American owned firms undertook 53 per cent of BERD in Scotland, followed by Scottish based firms (25%).
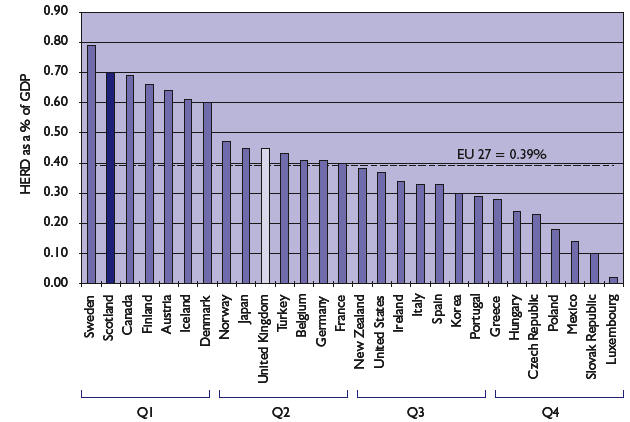
Although business expenditure on R&D is relatively low, Scotland performs better on other measures of R&D. Scotland performs very well in terms of Higher Education R&D ( HERD). In 2005 Scottish HERD stood at £688 million, which is 12.4 per cent of the UK figure and 0.70 per cent of GDP. In comparison to other regions in the UK, Scotland is ranked first in terms of HERD as a percentage of GDP. At an international level, Scottish HERD as a percentage of GDP is in the first quartile of OECD countries, as illustrated in Chart 2.4, below only that of Sweden. The level of Scottish HERD is well above the EU 27 mean of 0.39 per cent. Scotland also performs well in terms of Government expenditure on R&D ( GovERD) as a percentage of GDP Scotland comes 3rd in 2005 compared to other regions of the UK.
Chart 2.4: HERD as a % of GDP for Scotland and OECD countries that reported in 2005
Source: Scottish Government, OECD ( MSTI 2008/1)
Innovative Products or Processes
The Community Innovation Survey ( CIS) provides a regular snapshot of innovation inputs, outputs and the constraints faced by businesses in their innovation activities, across the range of industries and business enterprises. The fifth UK Innovation Survey 5 ( CIS5) was conducted by the Department for Innovation, Universities and Skills ( DIUS) in 2007 and provides information on the period 2004-2006.
The CIS5 found that 63 per cent of Scottish firms were innovation active, this is an increase of 7 percentage points since the last survey, which covered the period 2002-2004. This is the same rate of increase as the UK, which increased from 57 per cent to 64 per cent over the same period ( Table 2.8).
Commercialisation of Research by Higher Education Institutes
Universities and colleges contribute to the competitiveness of Scotland's Economy through the commercialisation and transfer of knowledge. This activity is more intensive in Scotland than would be expected on the basis of its population size; this is, in part, due to the relatively higher number of Higher Education Institutes ( HEIs) in Scotland.
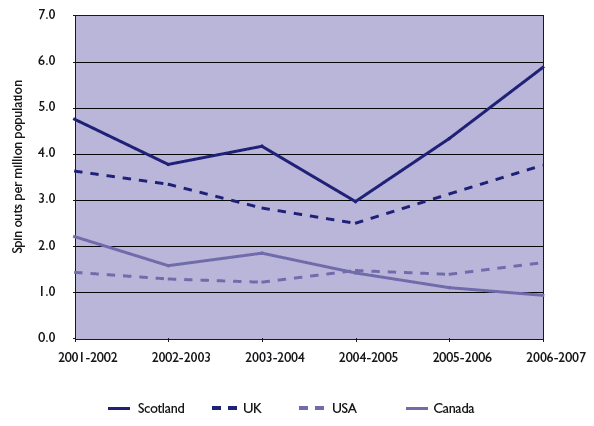
The Higher Education-Business and Community Interaction survey ( HE- BCI) 6 covers the strategies and activities undertaken by HEIs on the commercialisation of knowledge. Table 2.9 shows some selected results from the survey. Scotland performs well compared to other countries on measures of knowledge transfer, including spin offs per million population (Chart 2.5).
Chart 2.5: Number of University spin out companies per million population 2001-02 to 2006-07
Source: HEFCE (2007), AUTM (2006), ONS (2007)
Patents Filed and Granted
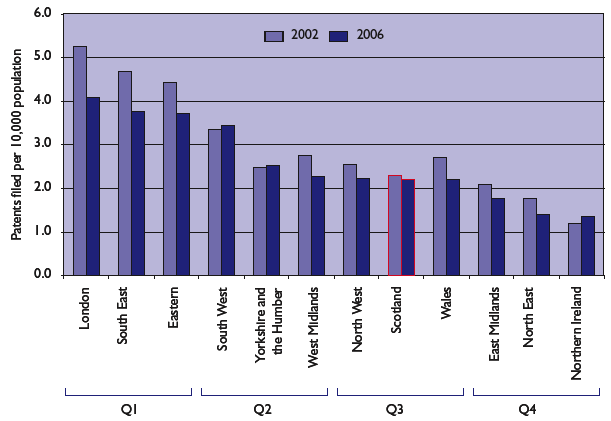
Patents represent an outcome of technologically oriented innovation. The UK Intellectual Property Office 7 (formerly The Patent Office) publishes statistics on a regional basis, which are derived from the postcode of the applicant. In 2006 Scottish applicants filed 1,131 patents, which is 6.5 per cent of the UK total. Chart 2.6 shows that Scotland is in the third quartile of UK regions with 2.2 patents filed per 10,000 population, below the UK average of 2.9.
Chart 2.6: Patents filed per 10,000 population, 2002 and 2006
Source: UK Intellectual Property Office (2007) and ONS
E-Business
E-business processes are important to businesses, for improving and maintaining efficiency and competitiveness in the Scottish Economy. Adoption of these processes are currently measured via various surveys, within and out with Scotland.
Results from the latest Scottish E-Business Survey ( SEBS), 8 carried out by Scottish Enterprise and Highlands and Islands Enterprise, were published in January 2008. The survey captured information from over 4,000 companies of all sizes and types across Scotland on their attitudes to e-business, levels of ownership, usage and preferred support services. Table 2.10 shows the percentage of businesses that consider e-business to be important to their needs decreased by 1 per cent to 67 per cent in 2007. The percentage of businesses that have their own website increased from 46 per cent to 51 per cent in 2007, which is the highest level since the survey began. Furthermore, trading online is becoming more popular with 55 per cent of connecting businesses placing orders over the internet and 39 per cent of connecting businesses receiving orders via the internet in 2007.
Broadband is potentially one of the major facilitators of e-commerce in both new and old enterprises, offering access to major new market opportunities and re-engineering existing processes to reduce costs and/or improve customer service. It is therefore encouraging to see that of all those businesses with an internet connection, the proportion using Broadband has increased significantly each year since 2002 to reach 89 per cent in 2007.
Box 2.2 Useful References Scottish Corporate Sector Statistics 2008: ' UK Business: Activity, Size and Location', 2008 publication: Inter Departmental Business Register: VAT Registrations/De-registrations 2006: Business Survival Rates 2005: Scottish Business Enterprise Research and Development ( BERD) 2006 Scottish Results of the Higher Education - Business and Community Interaction Survey 2006-2007 Higher Education Funding Council for England ( HEFCE) Website The UK Intellectual Property Office Website Organisation for Economic Co-operation and Development ( OECD) Website |
There is a problem
Thanks for your feedback