Scottish Vacant And Derelict Land Survey 2021
The Scottish Vacant and Derelict Land Survey (SVDLS) is a data collection undertaken to establish the extent and state of vacant and derelict land in Scotland.
This document is part of a collection
12. Derelict and Urban Vacant Land: New, Reclaimed and Naturalised Sites
12.1 There were 60 hectares (41 sites) of newly identified derelict land since the previous survey. The largest amount was in North Lanarkshire (13 hectares across 8 sites). There were 66 hectares (52 sites) of newly identified urban vacant land since the previous survey. Over 70% was in Aberdeen city, 47 hectares across 23 sites. These figures relate only to new sites first identified as vacant or derelict in 2021. They do not include sites listed in the previous survey which changed in size or changed from derelict to vacant or vice versa (Table 18). Glasgow conducted a partial survey in 2021 and some sites were recorded as re-used but no new sites were added due to difficulty with resource for the survey. Dundee City and West Lothian have not updated their survey since 2019 so no new data is available on new sites in 2021.
12.2 A total of 966 hectares (252 sites) were reclaimed or brought back into use since the previous survey, excluding those sites removed for definitional reasons or due to naturalisation. 823 hectares (129 sites) was previously derelict. Two airfields in Highland reclaimed for agriculture accounted for 600 hectares. There were 143 hectares (123 sites) reclaimed of previously urban vacant land (Table 19).
12.3 Reclaimed sites relate only to sites (or parts of sites) which were brought back into use. Sites removed due to naturalisation or for definitional reasons are not included. In 2021, 1,019 hectares 52 sites of formerly derelict and urban vacant land were removed due to naturalisation (Table 21). This was mostly due to the naturalisation of 11 former coal mining sites in East Ayrshire (909 hectares). In addition, 44 sites (49 hectares) were removed for definitional reasons - further details can be found in Annex C.
12.4 Residential development was the new use of almost half of the number of sites reclaimed, but the two airfields reclaimed in Highland resulted in the largest area for a new use of agriculture (600 hectares) (Table 20).
12.5 For urban vacant land the most common new use was residential development with 48% of sites (59 of 123) and 50% of the total area brought back into use (71 of 143 hectares) (Table 20).
12.6 In 2021 the source of funding for the two airfields brought back into use was unknown and this affected the proportion of reclaimed land with known funding. Only 216 hectares (22%) of reclaimed land had a known source of funding.
12.7 The largest area brought back into use with known sources of funding involved private sector funding (113 of 216 hectares, 52%). Public sector funding accounted for 76 hectares (35%) and mixed public and private funding was used for 27 hectares (13%). Glasgow City (37 hectares) had the largest area brought back into use with only private funding and South Lanarkshire (13 hectares) reported the largest areas brought back into use with only public funding (Table 22).
| Derelict Land | Urban Vacant Land | Total | ||||
|---|---|---|---|---|---|---|
| Planning Authority | Area | Sites | Area | Sites | Area | Sites |
| Aberdeen City | * | 1 | 47 | 23 | 47 | 24 |
| Aberdeenshire | 1 | 1 | 2 | 2 | 3 | 3 |
| Angus | * | 1 | - | - | * | 1 |
| Argyll and Bute | - | - | * | 1 | * | 1 |
| Clackmannanshire | - | - | - | - | - | - |
| Dumfries and Galloway | 10 | 6 | 1 | 1 | 11 | 7 |
| Dundee City | - | - | - | - | - | - |
| East Ayrshire | 1 | 1 | 3 | 8 | 3 | 9 |
| East Dunbartonshire | - | - | * | 1 | * | 1 |
| East Lothian | - | - | - | - | - | - |
| East Renfrewshire | - | - | - | - | - | - |
| City of Edinburgh | - | - | - | - | - | - |
| Falkirk | 10 | 3 | * | 2 | 10 | 5 |
| Fife | - | - | - | - | - | - |
| Glasgow City | - | - | - | - | - | - |
| Highland | 4 | 3 | 1 | 1 | 5 | 4 |
| Inverclyde | - | - | - | - | - | - |
| Loch Lomond and The Trossachs National Park | - | - | - | - | - | - |
| Midlothian | 1 | 1 | 2 | 2 | 3 | 3 |
| Moray | - | - | - | - | - | - |
| Na h-Eileanan Siar | - | - | - | - | - | - |
| North Ayrshire | 2 | 5 | * | 2 | 3 | 7 |
| North Lanarkshire | 13 | 8 | 3 | 2 | 16 | 10 |
| Orkney Islands | - | - | - | - | - | - |
| Perth and Kinross | * | 1 | - | - | * | 1 |
| Renfrewshire | - | - | - | - | - | - |
| Scottish Borders | - | - | * | 1 | * | 1 |
| Shetland Islands | - | - | - | - | - | - |
| South Ayrshire | - | - | - | - | - | - |
| South Lanarkshire | 7 | 2 | 2 | 2 | 9 | 4 |
| Stirling | 1 | 2 | 1 | 2 | 1 | 4 |
| West Dunbartonshire | 9 | 6 | 4 | 2 | 13 | 8 |
| West Lothian | - | - | - | - | - | - |
| Scotland | 60 | 41 | 66 | 52 | 126 | 93 |
General notes - at sections 3 and 4 apply.
Specific note 7 - sites identified since the previous survey but recorded as falling out of use prior to 2020 are not included in the above table.
Specific note 20 - Glasgow conducted a partial survey in 2021 and some sites were recorded as re-used but no new sites were added due to difficulty with resource for the survey. Dundee City and West Lothian have not updated their survey since 2019 so no new data is available on new site in 2021. Details of survey return rates back to 2015 are shown at Annex D.
Specific note 24 - six authorities reported various impacts of the COVID-19 Pandemic on their survey return in 2021. More details are provided at sections 3 and 4. These impacts should be borne in mind when using and interpreting the figures for these authorities in the year 2021, when comparing the 2021 figure to other years and when interpreting the Scotland total for 2021.
| Derelict Land | Urban Vacant Land | Total | |||||||
|---|---|---|---|---|---|---|---|---|---|
| Planning Authority | Area | Percentage of Derelict Land | Sites | Area | Percentage of Urban Vacant Land | Sites | Area | Percentage of Total Land | Sites |
| Aberdeen City | * | * | 1 | 10 | 7 | 8 | 10 | 1 | 9 |
| Aberdeenshire | 1 | * | 1 | 4 | 3 | 2 | 5 | * | 3 |
| Angus | - | - | - | - | - | - | - | - | - |
| Argyll and Bute | - | - | - | 1 | 1 | 4 | 1 | * | 4 |
| Clackmannanshire | - | - | - | * | * | 1 | * | * | 1 |
| Dumfries and Galloway | - | - | - | 2 | 1 | 1 | 2 | * | 1 |
| Dundee City | - | - | - | - | - | - | - | - | - |
| East Ayrshire | 3 | * | 4 | 22 | 15 | 8 | 25 | 3 | 12 |
| East Dunbartonshire | * | * | 1 | - | - | - | * | * | 1 |
| East Lothian | - | - | - | - | - | - | - | - | - |
| East Renfrewshire | * | * | 1 | - | - | - | * | * | 1 |
| City of Edinburgh | 6 | 1 | 4 | 6 | 4 | 5 | 12 | 1 | 9 |
| Falkirk | 5 | 1 | 5 | 1 | 1 | 2 | 6 | 1 | 7 |
| Fife | 7 | 1 | 6 | 5 | 4 | 5 | 13 | 1 | 11 |
| Glasgow City | 25 | 3 | 13 | 35 | 24 | 18 | 60 | 6 | 31 |
| Highland | 701 | 85 | 33 | 15 | 10 | 33 | 716 | 74 | 66 |
| Inverclyde | * | * | 1 | 3 | 2 | 4 | 4 | * | 5 |
| Loch Lomond and the Trossachs National Park | - | - | - | - | - | - | - | - | - |
| Midlothian | 6 | 1 | 3 | 4 | 3 | 4 | 10 | 1 | 7 |
| Moray | - | - | - | 1 | 1 | 2 | 1 | * | 2 |
| Na h-Eileanan Siar | - | - | - | 2 | 1 | 1 | 2 | * | 1 |
| North Ayrshire | - | - | - | * | * | 1 | * | * | 1 |
| North Lanarkshire | 23 | 3 | 24 | 9 | 6 | 6 | 32 | 3 | 30 |
| Orkney Islands | |||||||||
| Perth and Kinross | - | - | - | 2 | 2 | 1 | 2 | * | 1 |
| Renfrewshire | 11 | 1 | 2 | 8 | 5 | 4 | 18 | 2 | 6 |
| Scottish Borders | * | * | 1 | * | * | 1 | * | * | 2 |
| Shetland Islands | - | - | - | - | - | - | - | - | - |
| South Ayrshire | 2 | * | 3 | * | * | 1 | 2 | * | 4 |
| South Lanarkshire | 16 | 2 | 14 | 9 | 6 | 8 | 24 | 3 | 22 |
| Stirling | 1 | * | 2 | * | * | 1 | 1 | * | 3 |
| West Dunbartonshire | 15 | 2 | 10 | 4 | 2 | 2 | 18 | 2 | 12 |
| West Lothian | - | - | - | - | - | - | - | - | - |
| Scotland | 823 | 100 | 129 | 143 | 100 | 123 | 966 | 100 | 252 |
General notes - at sections 3 and 4 apply.
Specific note 8 - excludes naturalised sites and sites that have been removed as they no longer meet the required definitions for derelict or urban vacant land.
Specific note 9 - the number of sites refers to the number of packages of land classed as reused and may not directly correspond a full site that was previously listed as vacant or derelict. For example if a previously vacant site was partly reused for residential and partly for passive open space while the remainder was still classed as vacant it would be listed as 2 separate reused sites in the table and also still remain on the vacant land register.
Specific note 20 - Glasgow conducted a partial survey in 2021 and some sites were recorded as re-used but no new sites were added due to difficulty with resource for the survey. Dundee City and West Lothian have not updated their survey since 2019 so no new data is available on new site in 2021. Details of survey return rates back to 2015 are shown at Annex D.
Specific note 24 - six authorities reported various impacts of the COVID-19 Pandemic on their survey return in 2021. More details are provided at sections 3 and 4. These impacts should be borne in mind when using and interpreting the figures for these authorities in the year 2021, when comparing the 2021 figure to other years and when interpreting the Scotland total for 2021.
| Derelict Land | Urban Vacant Land | Total | |||||||
|---|---|---|---|---|---|---|---|---|---|
| New Use | Area | Percentage of Derelict Land | Sites | Area | Percentage of Urban Vacant Land | Sites | Area | Percentage of Total Land | Sites |
| Agriculture | 600 | 73 | 3 | - | - | - | 600 | 62 | 3 |
| Community Health | 1 | * | 1 | * | * | 1 | 1 | * | 2 |
| Education | 5 | 1 | 5 | 4 | 3 | 3 | 9 | 1 | 8 |
| Passive Open Space | 4 | * | 1 | 12 | 8 | 2 | 15 | 2 | 3 |
| Recreation & Leisure | 30 | 4 | 11 | 3 | 2 | 3 | 33 | 3 | 14 |
| Manufacturing | 3 | * | 1 | 14 | 10 | 8 | 18 | 2 | 9 |
| Other General Industrial | 77 | 9 | 13 | 7 | 5 | 12 | 84 | 9 | 25 |
| Mineral Activity | 13 | 2 | 1 | - | - | - | 13 | 1 | 1 |
| Offices | 2 | * | 2 | 2 | 1 | 2 | 3 | * | 4 |
| Residential | 66 | 8 | 57 | 71 | 50 | 59 | 137 | 14 | 116 |
| Retailing | 5 | 1 | 4 | 22 | 15 | 13 | 27 | 3 | 17 |
| Storage | 2 | * | 11 | 2 | 1 | 6 | 4 | * | 17 |
| Transport | 7 | 1 | 11 | 2 | 1 | 5 | 9 | 1 | 16 |
| Utility Services | * | * | 1 | - | - | - | * | * | 1 |
| Wholesale Distribution | 3 | * | 2 | * | * | 1 | 3 | * | 3 |
| Business Class | 3 | * | 1 | 3 | 2 | 5 | 6 | 1 | 6 |
| Green/Environmental | 1 | * | 1 | 1 | 1 | 2 | 2 | * | 3 |
| Other | 1 | * | 3 | * | * | 1 | 2 | * | 4 |
| Total | 823 | 100 | 129 | 143 | 100 | 123 | 966 | 100 | 252 |
General notes - at sections 3 and 4 apply.
Specific note 9 - the number of sites refers to the number of packages of land classed as reused and may not directly correspond a full site that was previously listed as vacant or derelict. For example if a previously vacant site was partly reused for residential and partly for passive open space while the remainder was still classed as vacant it would be listed as 2 separate reused sites in the table and also still remain on the vacant land register.
Specific note 20 - Glasgow conducted a partial survey in 2021 and some sites were recorded as re-used but no new sites were added due to difficulty with resource for the survey. Dundee City and West Lothian have not updated their survey since 2019 so no new data is available on new site in 2021. Details of survey return rates back to 2015 are shown at Annex D.
Specific note 24 - six authorities reported various impacts of the COVID-19 Pandemic on their survey return in 2021. More details are provided at sections 3 and 4. These impacts should be borne in mind when using and interpreting the figures for these authorities in the year 2021, when comparing the 2021 figure to other years and when interpreting the Scotland total for 2021.
| Derelict Land | Urban Vacant Land | Total | ||||
|---|---|---|---|---|---|---|
| Planning Authority | Area | Sites | Area | Sites | Area | Sites |
| East Ayrshire | 911 | 15 | 18 | 4 | 929 | 19 |
| Falkirk | - | - | 2 | 1 | 2 | 1 |
| Highland | 49 | 12 | * | 1 | 49 | 13 |
| Midlothian | 11 | 7 | - | - | 11 | 7 |
| North Ayrshire | 8 | 6 | 1 | 1 | 9 | 7 |
| Scottish Borders | 1 | 1 | - | - | 1 | 1 |
| South Ayrshire | 14 | 1 | 4 | 2 | 19 | 3 |
| South Lanarkshire | - | - | * | 1 | * | 1 |
| All | 993 | 42 | 26 | 10 | 1,019 | 52 |
General notes - at sections 3 and 4 apply.
Specific note 24 - some authorities reported various impacts of the COVID-19 Pandemic on their survey return in 2021. More details are provided at sections 3 and 4. These impacts should be borne in mind when using and interpreting the figures for these authorities in the year 2021, when comparing the 2021 figure to other years and when interpreting the Scotland total for 2021.
| Planning Authority | Public sector funding | Private sector funding | Mixed funding Prviate and Public | Unknown | None / not applicable | Total Area |
|---|---|---|---|---|---|---|
| Aberdeen City | 9 | 1 | - | - | - | 10 |
| Aberdeenshire | - | 4 | - | 1 | - | 5 |
| Angus | - | - | - | - | - | - |
| Argyll and Bute | - | - | - | 1 | - | 1 |
| Clackmannanshire | * | - | - | - | - | * |
| Dumfries and Galloway | - | - | 2 | - | - | 2 |
| Dundee City | - | - | - | - | - | - |
| East Ayrshire | * | 13 | - | - | 11 | 25 |
| East Dunbartonshire | - | * | - | - | - | * |
| East Lothian | - | - | - | - | - | - |
| East Renfrewshire | - | * | - | - | - | * |
| City of Edinburgh | 7 | 5 | - | - | - | 12 |
| Falkirk | - | 5 | - | - | 1 | 6 |
| Fife | 7 | - | 5 | - | - | 13 |
| Glasgow City | 11 | 37 | 12 | - | - | 60 |
| Highland | - | - | - | 716 | - | 716 |
| Inverclyde | 4 | - | - | - | - | 4 |
| Loch Lomond and the Trossachs National Park | - | - | - | - | - | - |
| Midlothian | - | 7 | 3 | - | - | 10 |
| Moray | - | * | * | - | - | 1 |
| Na h-Eileanan Siar | - | - | 2 | - | - | 2 |
| North Ayrshire | - | - | - | - | * | * |
| North Lanarkshire | 12 | 21 | - | - | - | 32 |
| Orkney Islands | - | - | - | - | - | - |
| Perth and Kinross | 2 | - | - | - | - | 2 |
| Renfrewshire | - | - | - | - | 18 | 18 |
| Scottish Borders | - | * | - | - | - | * |
| Shetland Islands | - | - | - | - | - | - |
| South Ayrshire | * | 2 | - | - | - | 2 |
| South Lanarkshire | 13 | 11 | - | * | - | 24 |
| Stirling | - | 1 | - | 1 | - | 1 |
| West Dunbartonshire | 11 | 5 | 3 | - | - | 18 |
| West Lothian | - | - | - | - | - | - |
| Scotland | 76 | 113 | 27 | 719 | 31 | 966 |
General notes - at sections 3 and 4 apply.
Specific note 8 - excludes naturalised sites and sites that have been removed as they no longer meet the required definitions for derelict or urban vacant land.
Specific note 20 - Glasgow conducted a partial survey in 2021 and some sites were recorded as re-used but no new sites were added due to difficulty with resource for the survey. Dundee City and West Lothian have not updated their survey since 2019 so no new data is available on new site in 2021. Details of survey return rates back to 2015 are shown at Annex D.
Specific note 24 - six authorities reported various impacts of the COVID-19 Pandemic on their survey return in 2021. More details are provided at sections 3 and 4. These impacts should be borne in mind when using and interpreting the figures for these authorities in the year 2021, when comparing the 2021 figure to other years and when interpreting the Scotland total for 2021.
General notes - at sections 3 and 4 apply.
Specific note 19 - 506 hectares from a single former Royal Ordnance site at Bishopton, Renfrewshire, in 2017
Specific note 20 - Glasgow conducted a partial survey in 2021 and some sites were recorded as re-used but no new sites were added due to difficulty with resource for the survey. Dundee City and West Lothian have not updated their survey since 2019 so no new data is available on new site in 2021. Details of survey return rates back to 2015 are shown at Annex D.
Specific note 23 - For the 2020 survey eight authorities (Aberdeen City, Dundee City, East Ayrshire, Highland, Loch Lomond and the Trossachs, Ornkey Islands, West Dunbartonshire and West Lothian) were unable to complete a survey mainly due to COVID-19 Pandemic related restrictions but also staffing issues and results have been rolled over from 2019. These return rates should be borne in mind when using and interpreting the figures for these authorities in the year 2020, when interpreting the Scotland total in 2020 and when comparing the 2020 figures to other years.
Specific note 24 - six authorities reported various impacts of the COVID-19 Pandemic on their survey return in 2021. More details are provided at sections 3 and 4. These impacts should be borne in mind when using and interpreting the figures for these authorities in the year 2021, when comparing the 2021 figure to other years and when interpreting the Scotland total for 2021.
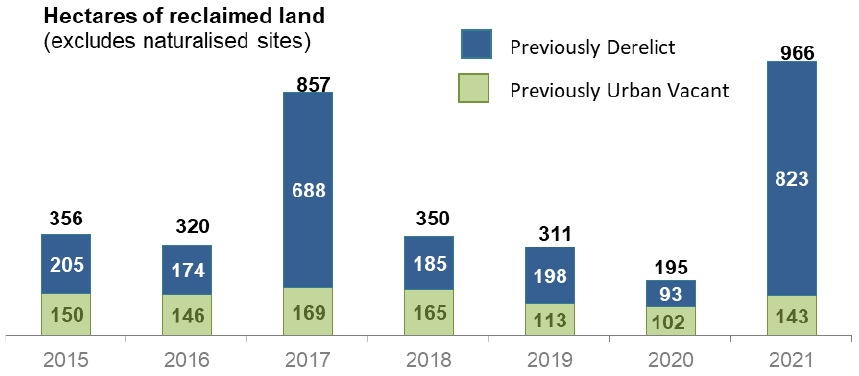
12.8 The amount of previously derelict land reclaimed in 2021 is the highest amount over the last seven years due to the reclaiming of two airfields. The amount reclaimed has varied over the period 2015 to 2021 and has been affected by the reclaiming of large sites. The area of urban vacant land is not as variable over the period. The relatively low amount reported as reclaimed in 2020 reflects the difficulties the authorities experienced in carrying out the survey or making a return during the Covid-19 pandemic. Particular care should be taken when interpreting the data for 2020 as eight authorities were unable to complete a survey return mainly due to COVID-19 Pandemic related restrictions and results have been rolled over from 2019. This will affect the figures for each of these authorities, the Scotland total and any comparison with other years. More detailed information on this is presented in section 4 of the publication and in the notes accompanying tables, chart and annexes.
| Site Type | 2015 | 2016 | 2017 | 2018 | 2019 | 2020 | 2021 |
|---|---|---|---|---|---|---|---|
| Derelict Land Area | 205 | 174 | 688 | 185 | 198 | 93 | 823 |
| Sites | 119 | 125 | 129 | 135 | 120 | 81 | 129 |
| Urban Vacant Land Area | 150 | 146 | 169 | 165 | 113 | 102 | 143 |
| Sites | 194 | 154 | 188 | 183 | 130 | 90 | 123 |
| Total Area | 356 | 320 | 857 | 350 | 311 | 195 | 966 |
| Total Sites | 313 | 279 | 317 | 318 | 250 | 171 | 252 |
General notes - at sections 3 and 4 apply.
Specific note 4 - during 2021, historical data for the years 2015-2020 were updated as a result of improved information. This included removing sites that should not have been included in previous years, adding sites that should have been included earlier and making any required changes to site size. Further information on this process is available in the Annex along with un-amended historical data for the survey years 2000-2014.
Specific note 8 - excludes naturalised sites and sites that have been removed as they no longer meet the required definitions for derelict or urban vacant land.
Specific note 9 - the number of sites refers to the number of packages of land classed as reused and may not directly correspond a full site that was previously listed as vacant or derelict. For example if a previously vacant site was partly reused for residential and partly for passive open space while the remainder was still classed as vacant it would be listed as 2 separate reused sites in the table and also still remain on the vacant land register.
Specific note 20 - Glasgow conducted a partial survey in 2021 and some sites were recorded as re-used but no new sites were added due to difficulty with resource for the survey. Dundee City and West Lothian have not updated their survey since 2019 so no new data is available on new site in 2021. Details of survey return rates back to 2015 are shown at Annex D.
Specific note 23 - For the 2020 survey eight authorities (Aberdeen City, Dundee City, East Ayrshire, Highland, Loch Lomond and the Trossachs, Ornkey Islands, West Dunbartonshire and West Lothian) were unable to complete a survey mainly due to COVID-19 Pandemic related restrictions but also staffing issues and results have been rolled over from 2019. These return rates should be borne in mind when using and interpreting the figures for these authorities in the year 2020, when interpreting the Scotland total in 2020 and when comparing the 2020 figures to other years.
Specific note 24 - six authorities reported various impacts of the COVID-19 Pandemic on their survey return in 2021. More details are provided at sections 3 and 4. These impacts should be borne in mind when using and interpreting the figures for these authorities in the year 2021, when comparing the 2021 figure to other years and when interpreting the Scotland total for 2021.
12.9 The Scottish Government’s Vacant and Derelict Land Fund (VDLF) has made either a partial or full contribution to the removal of 31 hectares (Table 24). This is lower than previous years and it’s likely to have been affected by the impact of the Covid-19 pandemic on the activities of Planning Authorities.
Glasgow City and North Lanarkshire have been in receipt of this fund since it started in 2005/06, South Lanarkshire since 2006/07. In 2021/22, Fife and North Ayrshire were also included in the fund.
12.10 Glasgow City has the largest area of re-used land where VDLF funding was used, 11 hectares (4 sites). Any involvement the VDLF has had with existing sites in the 2021 survey (i.e. those not yet removed from the survey) is not recorded in Table 24, but will appear when the sites are bought back into use in the future.
| Derelict Land | Urban Vacant Land | Total | ||||
|---|---|---|---|---|---|---|
| Planning Authority | Area | Sites | Area | Sites | Area | Sites |
| Fife | 5 | 2 | - | - | 5 | 2 |
| Glasgow City | 11 | 4 | - | - | 11 | 4 |
| North Lanarkshire | 9 | 2 | - | - | 9 | 2 |
| South Lanarkshire | 4 | 1 | 2 | 1 | 5 | 2 |
| Total | 29 | 9 | 2 | 1 | 31 | 10 |
General notes - at sections 3 and 4 apply.
Specific note 9 - the number of sites refers to the number of packages of land classed as reused and may not directly correspond a full site that was previously listed as vacant or derelict. For example if a previously vacant site was partly reused for residential and partly for passive open space while the remainder was still classed as vacant it would be listed as 2 separate reused sites in the table and also still remain on the vacant land register.
Specific note 20 - Glasgow conducted a partial survey in 2021 and some sites were recorded as re-used but no new sites were added due to difficulty with resource for the survey. Dundee City and West Lothian have not updated their survey since 2019 so no new data is available on new site in 2021. Details of survey return rates back to 2015 are shown at Annex D.
Specific note 24 - some authorities reported various impacts of the COVID-19 Pandemic on their survey return in 2021. More details are provided at sections 3 and 4. These impacts should be borne in mind when using and interpreting the figures for these authorities in the year 2021, when comparing the 2021 figure to other years and when interpreting the Scotland total for 2021.
12.11 Across the seven councils in the VDLF for 2005 to 2021, in 2021 an estimated 187,900 properties (both private households and communal establishments*) were within 500 metres of land reclaimed with the involvement of the VDLF (either solely or in combination with other funds) (Table 25). Of those properties, 56% (105,800) were within 500 metres of 1 site reclaimed with the involvement of the VDLF, 20% (36,900) were within 500 metres of 2 reclaimed sites, and the remaining properties were within 500 metres of at least 3 reclaimed sites. To date, the largest number of properties in close proximity to land reclaimed using the VDLF is located within Glasgow City (72,600 properties).
| Number of properties within 500 meters of land reclaimed using the Scottish Government Vacant and Derelict Land Fund | ||||
|---|---|---|---|---|
| Planning Authority | 1 Site | 2 Sites | 3 Sites Plus | Total |
| Dundee City [Note 10] | 12,300 | 8,100 | 21,800 | 42,200 |
| Fife | 2,500 | - | - | 2,500 |
| Glasgow City [Note 11] [Note13] | 37,900 | 19,000 | 15,700 | 72,600 |
| Highland | 14,600 | 2,000 | 100 | 16,700 |
| North Ayrshire | 4,500 | 400 | - | 4,900 |
| North Lanarkshire | 17,500 | 4,900 | 3,100 | 25,500 |
| South Lanarkshire [Note 12] | 16,500 | 2,500 | 4,500 | 23,500 |
| Total | 105,800 | 36,900 | 45,200 | 187,900 |
General notes - at sections 3 and 4 apply.
Specific note 9 - the number of sites refers to the number of packages of land classed as reused and may not directly correspond a full site that was previously listed as vacant or derelict. For example if a previously vacant site was partly reused for residential and partly for passive open space while the remainder was still classed as vacant it would be listed as 2 separate reused sites in the table and also still remain on the vacant land register.
Specific note 10 - an estimated further 100 properties within Angus and Perth and Kinross are located within 500 metres of a reclaimed derelict site within Dundee City boundaries.
Specific note 11 - an estimated 100 properties within Renfrewshire are located within 500 metres of a reclaimed derelict site within Glasgow City boundaries.
Specific note 12 - an estimated 1,000 properties are located within 500 metres of a reclaimed derelict site within Glasgow City boundaries, 100 of these are also within 500m of a site in South Lanarkshire.
Specific note 13 - An estimated 3,400 properties are located within 500 metres of a reclaimed derelict site within South Lanarkshire boundaries. 2,400 of these are also within 500m of a site in Glasgow City.
Specific note 14 - properties that are estimated to have been built on the reclaimed site have been removed from this analysis.
Specific note 20 - Glasgow conducted a partial survey in 2021 and some sites were recorded as re-used but no new sites were added due to difficulty with resource for the survey. Dundee City and West Lothian have not updated their survey since 2019 so no new data is available on new site in 2021. Details of survey return rates back to 2015 are shown at Annex D.
Specific note 24 - some authorities reported various impacts of the COVID-19 Pandemic on their survey return in 2021. More details are provided at sections 3 and 4. These impacts should be borne in mind when using and interpreting the figures for these authorities in the year 2021, when comparing the 2021 figure to other years and when interpreting the Scotland total for 2021.
12.12 Overall, half of the 187,900 properties within 500 metres of land reclaimed using the VDLF were situated within Scotland's 15% most deprived data zones, 93,800 properties (Table 26). The percentage of properties in close proximity to land reclaimed using the VDLF that were situated within the 15% most deprived data zones varied between councils. Glasgow City had the highest percentage, 62%, Highland had the lowest, 27%.
| Properties Within 500 meters of Land Reclaimed Using the Scottish Government Vacant and Derelict Land Fund Planning | ||||
|---|---|---|---|---|
| Planning Authority | Within 15 Percent Most Deprived Datazones | Outwith 15 Percent Most Deprived Datazones | Total | Percent of Properties Near Remediated Land Within 15 Percent Most Deprived Datazones |
| Dundee City [Note 10] | 20,400 | 21,800 | 42,200 | 48% |
| Fife | 700 | 1,800 | 2,500 | 28% |
| Glasgow City [Note 11] [Note13] | 45,100 | 27,500 | 72,600 | 62% |
| Highland | 4,500 | 12,200 | 16,700 | 27% |
| North Ayrshire | 2,700 | 2,200 | 4,900 | 55% |
| North Lanarkshire | 10,600 | 14,900 | 25,500 | 42% |
| South Lanarkshire [Note 12] | 9,800 | 13,700 | 23,500 | 42% |
| Total | 93,800 | 94,100 | 187,900 | 50% |
General notes - at sections 3 and 4 apply.
Specific note 9 - the number of sites refers to the number of packages of land classed as reused and may not directly correspond a full site that was previously listed as vacant or derelict. For example if a previously vacant site was partly reused for residential and partly for passive open space while the remainder was still classed as vacant it would be listed as 2 separate reused sites in the table and also still remain on the vacant land register.
Specific note 10 - an estimated further 100 properties within Angus and Perth and Kinross are located within 500 metres of a reclaimed derelict site within Dundee City boundaries.
Specific note 11 - an estimated 100 properties within Renfrewshire are located within 500 metres of a reclaimed derelict site within Glasgow City boundaries.
Specific note 12 - an estimated 1,000 properties are located within 500 metres of a reclaimed derelict site within Glasgow City boundaries, 100 of these are also within 500m of a site in South Lanarkshire.
Specific note 13 - An estimated 3,400 properties are located within 500 metres of a reclaimed derelict site within South Lanarkshire boundaries. 2,400 of these are also within 500m of a site in Glasgow City.
Specific note 14 - properties that are estimated to have been built on the reclaimed site have been removed from this analysis.
Specific note 20 - Glasgow conducted a partial survey in 2021 and some sites were recorded as re-used but no new sites were added due to difficulty with resource for the survey. Dundee City and West Lothian have not updated their survey since 2019 so no new data is available on new site in 2021. Details of survey return rates back to 2015 are shown at Annex D.
Specific note 24 - some authorities reported various impacts of the COVID-19 Pandemic on their survey return in 2021. More details are provided at sections 3 and 4. These impacts should be borne in mind when using and interpreting the figures for these authorities in the year 2021, when comparing the 2021 figure to other years and when interpreting the Scotland total for 2021.
Contact
Email: planstats@gov.uk
There is a problem
Thanks for your feedback