Scottish Marine and Freshwater Science Volume 4 Number 5: Modelling of Noise Effects of Operational Offshore Wind Turbines including noise transmission through various foundation types
This report presents modelling of the acoustic output of operational off-shore wind
turbines and its dependence on the type of foundation structure used.
3 Near-field acoustic models
3.1 Modelling approach for comparison of offshore wind turbine foundations
In order to determine the variation in acoustic emissions that may affect marine life from offshore wind farms requires the source term to be quantified. This source term for underwater acoustics is dependent on the foundation used. By modelling the structural-acoustic interaction radiating from a single turbine-foundation system enables the foundations acoustic characteristics to be calculated. The spatial variation and intensity of the sound field with frequency produced in the near-field from differing foundation types provides the source term for far-field modelling of a wind farm array. The modelling approach for determining the near-field source term is as follows:
1) A model is constructed consisting of a structural domain of the turbine, foundation and sea floor; and an acoustic domain representing the marine environment.
2) A generic wind turbine is created loosely based on a 6 MW wind turbine generator. The tower is formed to achieve the desired hub height of 95 m. The model includes nacelle components, gear box and generator, allowing the input forces from rotating machinery in the gear box and E-M interaction in the generator to be applied.
3) Geometry for each of the foundation types - monopile, gravity and jacket, are designed for the desired water depth.
4) The 6 MW turbine model is placed on each of the foundation types. The wind turbine is identical for each of the foundations, resulting in three separate models for foundation comparison.
5) Each of the models is added to a seabed geometry, consisting of a sediment layer and a bedrock. The seabed geometry is also identical for all three of the foundation types.
6) An acoustic domain is formed around each of the foundations representing the sea water. Boundary conditions are applied to ensure the structural-acoustic interaction is representative of an operational wind turbine and the resultant sound field is as accurate as possible.
7) Frequency dependent excitation forces are applied to the nacelle components corresponding to a 6 MW wind turbine operating in wind speeds of 5 ms -1, 10 ms -1 and 15 ms -1.
8) A radially dependent boundary probe is placed around the foundation at a distance of 30 m and extends from the seabed to the surface of the water. The Sound Pressure Level calculated at this boundary probe as a result of the operational wind turbine becomes the source term for the far-field models for each of the foundation types.
3.2 Geometry used for acoustic modelling
3.2.1 Wind turbine generator and tower
The gross geometry of the generic wind turbine used for this study is based on a generic 6 MW machine. The tower height is 73 m in order to achieve a hub height of 95 m for the different foundations. The tower is divided into 3 distinct conical sections each of differing tower angle with interconnecting flanges. The overall tower is further subdivided into 29 shell elements of varying thickness for structural stability and dynamic response, Figure 3-1 ( 9 Appendix A, Doc 9-1). The nacelle, hub and blades are designed using solid elements forming a rotor blade length of 61.5 m. They are positioned to maintain the mass distribution with appropriate densities used to account for voids within the nacelle and enable an accurate dynamic response to be carried out, ( Doc 9-2). Within the nacelle cylindrical components are formed to represent the gear box and generator, providing the location for the excitation forces to be applied.
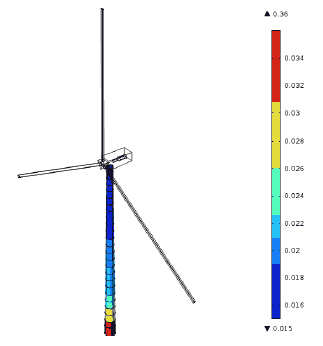
Figure 3-1 The tower for the wind turbine used here consisted of 29 independent shell sections of varying thickness, ranging from 0.015 m to 0.038 m.
The foundation design for an offshore wind turbine must take into account a number of factors of which are both site and turbine specific. To calculate the exact loads can only be derived when the following information is known and included in the design calculations:
- Design code (e.g. IEC 61400-3, DNV-OS-J101 or GL Guidelines)
- Overall layout (hub height, platform level, etc.)
- Water depth
- Wind conditions (extreme and fatigue conditions)
- Wave conditions (extreme and fatigue)
- Substructure layout
- Soil stiffness (and derived stiffness of foundations)
The water depths used for the acoustic modelling study were 30m for a monopole foundation and 50m for jackets and gravity based foundations as none of these structures have been installed to date under similar conditions. Therefore the designs used in this report are the best current representations of what might be installed based on the available data.
The actual designs of each of the foundations used in this work have been produced through developing designs based on publically available material, supplemented with additional material and advice provided by companies actively working within the sector.
The gravity base used is designed for a water depth of 50 m and from the documents provided, (Docs 9-3, 9-4, 9-5) is the tallest of the three foundations with a top surface reaching 70 m above the seabed. It therefore dictated the tower height to achieve the 95 m hub position. The gravity base is positioned on the surface of the seabed and has a circular footprint of radius 15.5 m. This extends to a height of 7 m after which the gravity base tapers in conically until a top radius of 3.5 m is achieved at a height of 27 m above the seabed. The final piece is a cylindrical section, again of a 3.5 m radius, up to the gravity base height of 70 m at which point a flanged connection is formed for the wind turbine tower to be mounted on.
The base cylinder and conical section is modelled as a solid with an internal cavity, calculated to hold the required ballast mass, ( Figure 3-2). The upper cylindrical section is modelled as shells, with thickness 0.12 m for the cylinder walls, (Doc 9-3) and a top flange thickness of 0.3 m.
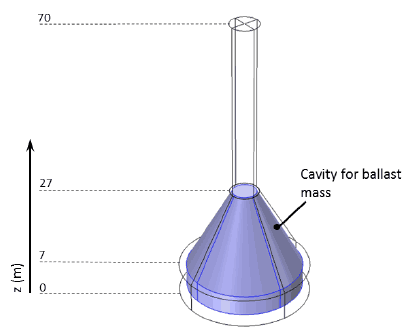
Figure 3-2 Geometry of gravity base highlighting the cavity within the lower conical section which is filled with a ballast mass. The vertical heights indicated have z = 0 m set at the surface of the seabed.
3.2.3 Jacket foundation
As with the gravity base the jacket foundation was required to be modelled in 50m of water. The overall structure of the jacket is the most complex of the three foundation types and can be seen in Figure 3-3.
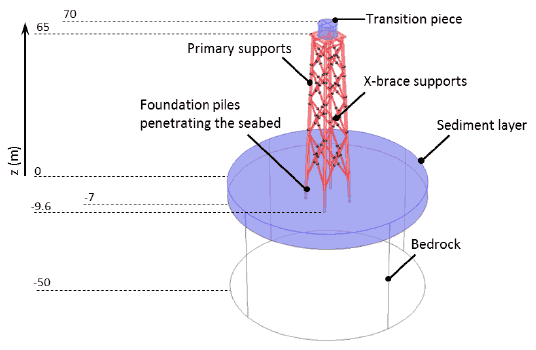
Figure 3-3 Geometry of the jacket used for the near-field modelling. The primary supports of the angled sides are of radius 0.6 m while the x-brace supports are smaller at a radius of 0.3 m. The vertical heights indicated have z = 0 m set at the surface of the seabed.
The jacket geometry was created from Docs 9-5, 9-6, 9-7, 9-8 and consists of four angled sides with primary supports of radius 0.6 m. Connecting x-braces are formed on each side using cylinders of radius 0.3 m. The entire jacket structure is modelled using shell elements with variable thickness capabilities, here using an initial thickness of 0.06 m. The primary supports penetrate to a depth of 9.6 m with the top of the jacket reaching a height of 65 m above the seabed. A cylindrical transition piece is included of height 5 m forming the surface on which the wind turbine tower is to be mounted. The dimensions are consistent with the top section of the gravity base and it has been designed so that a hub height of 95 m is achieved such that the performance of the jacket foundation can be compared to that of the gravity base.
3.2.4 Monopile
Monopiles are typically used in shallower water and so here it is modelled in a water depth of 30 m. The monopile is formed from two cylinders connected by a flange at the surface of the sediment layer. The penetration depth of the lower section is 50 m into the seabed and the top surface of the monopile is 40 m above the sediment. Using the generic 75 m wind turbine tower and nacelle with a water depth of 30 m requires a 10 m transition piece to be included in order to compare a 95 m hub height for all three foundations, Figure 3-4. The monopile geometry is modelled using shell elements as per Docs 9-2, 9-9, 9-10 with a thickness of 0.06 m producing the first bending mode at 0.18 Hz which is in agreement with Doc 9-9. The transition piece surface is again consistent with that used for the gravity base and the jacket foundation.
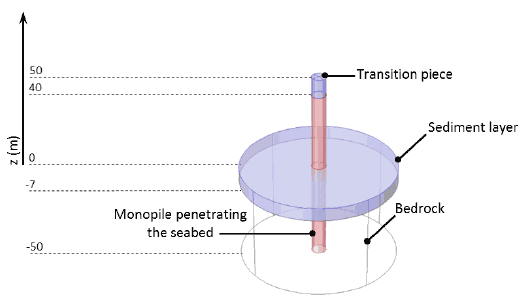
Figure 3-4 Geometry of the modelled monopile penetrating a depth of 50 m into the seabed and including a transition piece so that a consistent hub height of 95 m is achieved using the generic wind turbine. The vertical heights indicated have z = 0 m set at the surface of the seabed.
3.2.5 Water acoustic domain
To fully characterise the structural-acoustic interaction between the foundation and the water a radially dependent acoustic domain is formed. The geometry is cylindrical. In order to capture the acoustic response of the source term the SPL is calculated a distance of 30 m from the centre of the foundation using a cylindrical surface probe. To avoid reflected boundary discrepancies the acoustic domain is extended to a distance of 40 m allowing sufficient distance to minimise spurious results ( Figure 3-5).
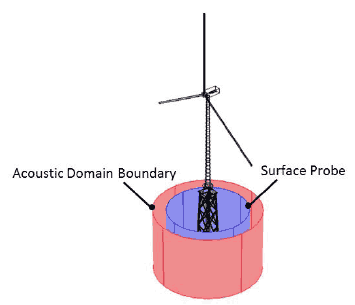
Figure 3-5 A cylindrical geometry is used for the acoustic domain. It extends 40 m from the centre of the foundation. A surface probe is used to calculate the radially and depth dependent acoustic emission and is positioned 30 m from the foundation centre.
3.2.6 Seabed domain
The seabed is modelled using solid elements and is comprised of a two part geometry. Again a cylindrical geometry is used extending to the external boundary of the acoustic domain. The two part separation forms an upper sediment layer of depth 7 m and a lower bedrock of depth 43 m so that the full extent of the deepest pile can be analysed, Figure 3-4.
3.3 Material properties
Structural steel was used for the wind turbine tower and nacelle as well as the jacket, monopile and cylindrical shell elements of the gravity base. The conical section of the gravity base was modelled as concrete while the cavity was filled with a ballast mass of 20 kilotonne of dense sands, (Docs 9-3, 9-5). The properties for the blades and nacelle were calculated to match the data provided in Docs 9-1, 9-2, 9-11. The acoustic domain was modelled as sea water with the sediment layer formed from dense sands. Table 3-1 presents the values used for these materials in the computational models.
The level of internal damping inherent to materials affects the dissipation of vibration energy and consequently the noise emitted. Internal damping of steel is less than that of concrete and is accounted for in the structural-acoustic interaction models using an isotropic loss factor of 0.0025 for structural steel and 0.05 for concrete and dense sands.
Table 3-1 Material properties used to model the structural-acoustic interaction of the wind turbine and foundations.
| Value | Units | |
|---|---|---|
| Structural Steel | ||
| Young's Modulus | 200 | GPa |
| Poisson's ratio | 0.33 | |
| Density | 7850 | kg/m3 |
| Damping Factor | 0.0025 | |
| Concrete | ||
| Young's Modulus | 25 | GPa |
| Poisson's ratio | 0.2 | |
| Density | 2400 | kg/m3 |
| Damping Factor | 0.05 | |
| Dense Sands | ||
| Young's Modulus | 5 | GPa |
| Poisson's ratio | 0.35 | |
| Density | 2020 | kg/m3 |
| Damping Factor | 0.05 | |
| Bedrock | ||
| Young's Modulus | 17 | GPa |
| Poisson's ratio | 0.2 | |
| Density | 2350 | kg/m3 |
| Water | ||
| Speed of sound | 1500 | m/s |
| Density | 1028 | kg/m3 |
3.4 Boundary conditions
The computational models require suitable boundary conditions to be set in order to determine the SPL from the structural-acoustic interaction. Each of the test models is comprised of two domains.
1) A structural domain where the dynamic response of the foundation mounted with an operational wind turbine generator is modelled.
2) An acoustic domain composed of sea water.
The boundary conditions were applied identically to each of the foundations to be tested for optimum comparison of foundation types.
3.4.1 Structural boundary conditions
The base of the bedrock is set as a fixed boundary while the cylindrical walls of both the bedrock and sediment layer have roller boundary conditions that restricts structural displacement normal to the cylindrical surface but otherwise it is free to move ( Figure 3-6).
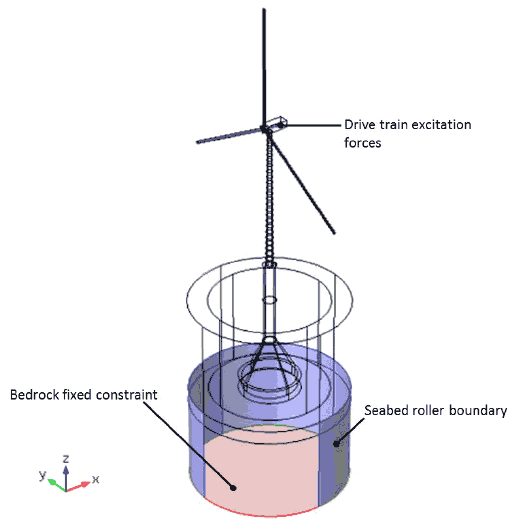
Figure 3-6 Structural boundary conditions applied to each of the foundation assemblies include a fixed base to the bedrock, roller boundary to the seabed cylindrical surface and variable excitation forces to the gearbox and generator in the nacelle.
The structural domain is excited by forces indicative of an operational wind turbine. These excitation forces originate from the drive train and are modelled using the gearbox and generator cylinders within the nacelle. The magnitude of the forces vary as a function of frequency such that they occur in discrete frequency bands related to both gear meshing and electro-magnetic (E-M) interaction between the spinning poles and stationary stators in the generator (i.e. it is a maximum at gear meshing / E-M interaction frequencies and close to zero elsewhere). The first 15 multiples of these excitation forces are applied as they can also result in triggering structural resonances. This is achieved using peaks of force in the frequency domain F (f) that take the form of summed normal distributions according to:
 (Eq 3.1)
where F (mesh/ EM) is the force representing the gear meshing or EM interaction at each step-up stage (the model is calibrated by varying the value of this parameter), f is the frequency, σ is a shape term that defines the frequency range over which the gear meshing / EM interaction is effective and f (mesh/ EM) is the gear meshing or EM interaction frequency. The magnitude of the excitation of the drive train is related to the torque acting on the rotor, which will be dependent on the wind speed.
The wind turbine used here is based on the specifications of the REPower 6 MW with a 12.1 rpm at a rated wind speed of 14 ms -1, 1:97 transmission ratio and a three stage planetary gear system, Doc 9-11. The magnitudes used for these frequency dependent forces for the gear meshing and E-M interaction are presented in Figure 3-7 and Figure 3-8 respectively.
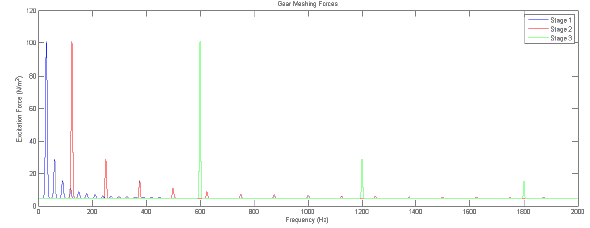
Figure 3-7 Excitation forces applied in the gearbox in the variable excitation models. The excitation forces represent those caused by teeth of the gears meshing together. The first fifteen multiples of each of the gear-meshing frequencies are also modelled. The amplitude of the excitation frequencies were estimated using previous measurements on similar wind turbines.
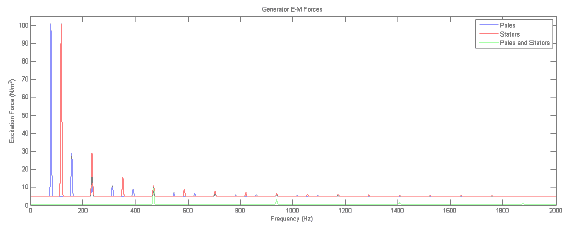
Figure 3-8 Excitation forces applied to the generator to model the effects of E-M fluctuations. The amplitude of the excitation frequencies were estimated using previous measurements on similar wind turbines.
The excitation forces applied to the drive train were calculated from the wind turbine specifications and compared to measurements of similar sized turbines carried out by Xi Engineering Consultants Ltd. The frequency parameters for the variable excitation used are shown in Table 3-2. The forces arising from the rotational motion of the drive train are modelled using the surface boundaries of the gear box and generator. It is assumed that the forces in the gear box and generator are proportional to the torque in the drive train and changes linearly with power. Figure 3-9 presents the Power curve for a REPower 6 MW wind turbine ( Doc 9-11). This enables the power, and therefore the force, for 5 ms -1, 10 ms -1 and 15 ms -1 to be calculated. The excitation forces are assigned to the surface boundaries of the gear box and generator, using Cartesian coordinates as indicated in Figure 3-6, with the magnitudes given in Table 3-3.
Table 3-2 Frequency parameters for the variable excitation forces applied to the drive train, representative of the wind turbine used. σ is a shape term that defines the frequency range over which the gear meshing / EM interaction is effective.
| 6 MW Wind Turbine Generator | ||
|---|---|---|
| Frequency (Hz) | σ (Hz) | |
| Gear Stage 1 | 30 | 3 |
| Gear Stage 2 | 125 | 2.5 |
| Gear Stage 3 | 600 | 2 |
| Generator Poles | 78 | 2 |
| Generator Stators | 117 | 2 |
| Pole - Stator Interaction | 469 | 2 |
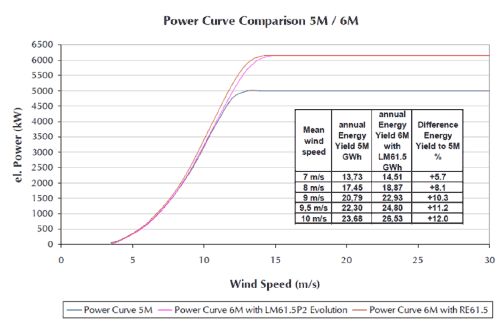
Figure 3-9 Power curve for a REPower 6 MW wind turbine, ( Doc 9-119-11). This enables the forces in the gear box and generator to be approximated for different wind speeds.
Table 3-3 Values of forces used to apply the variable excitation to the drive train. They are modelled using Cartesian coordinates assigned to the cylindrical surfaces of the gearbox and generator components in the nacelle.
| Wind Speed | |||
|---|---|---|---|
| v = 5 ms -1 | v = 10 ms -1 | v = 15 ms -1 | |
| F mesh/ EM (Pa) | F mesh/ EM (Pa) | F mesh/ EM (Pa) | |
| Gear Meshing (x) | 10 | 92 | 170 |
| Gear Meshing (y) | 33 | 572 | 1056 |
| Gear Meshing (z) | 10.5 | 97.5 | 180 |
| Generator E-M (x) | 9.5 | 89 | 162 |
| Generator E-M (y) | 9 | 84 | 155 |
| Generator E-M (z) | 7 | 65 | 120 |
3.4.2 Acoustic boundary conditions
The upper and lower surfaces of the acoustic domain (sea surface and seabed) are assumed to be perfect reflectors of noise and so will result in an overestimate, ( Section 2.2). Cylindrical wave radiation boundary conditions are applied to the vertical walls of the acoustic domain allowing pressure waves to propagate out of the model space. The boundary condition uses a simplification where the source of the cylindrical wave is taken to be co-linear with the vertical axis at the foundation centre, Figure 3-10.
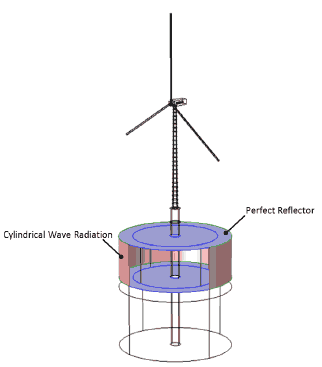
Figure 3-10 Acoustic boundary conditions used for the near-field foundation modelling. The sea surface and seabed are modelled as perfect reflectors. Cylindrical wave radiation is applied to the remaining acoustic domain boundaries to allow the pressure waves to continue propagating beyond the domain.
3.4.3 Structural-acoustic interaction
The structural and acoustic domains are coupled at their interface and modelled concurrently in the frequency domain. The surface acceleration of the foundation structure is monitored where in contact with the water and used to apply pressure to the acoustic domain, Figure 3-11. In this way the structural-borne vibration propagates into the water and radiates away as noise.
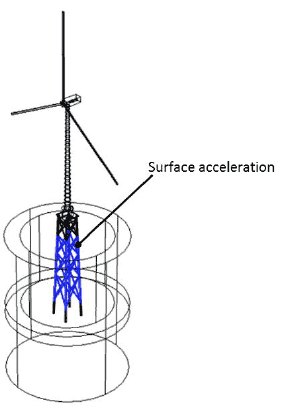
Figure 3-11 Coupling of the structural-acoustic interaction. Surface acceleration monitored at the boundary between the foundation and the sea water is used to apply pressure to the acoustic domain enabling the SPL to be calculated.
A free tetrahedral mesh was created. In order to calculate the SPL for each of the foundations the mesh needed to be optimised. By doing so enhances computational efficiency without sacrificing numerical accuracy. Problematic areas in the models geometries were identified at interconnecting flanges and brace elements, Figure 3-12.
To ensure the surface accelerations at the structural-acoustic interaction were captured and transmitted to the acoustic domain accurately, a maximum mesh element size of 1.5 m was set where the foundation was submerged in the sea, Figure 3-13. The subsequent pressure transferred to the acoustic domain could be calculated, again limiting the maximum mesh element size for numerical accuracy, here with a value of 7.5 m, Figure 3-14.
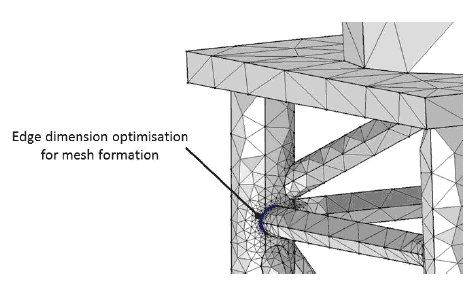
Figure 3-12 Mesh optimisation of jacket foundation brace. Problematic edges were assigned distributions of appropriate size for improved accuracy.
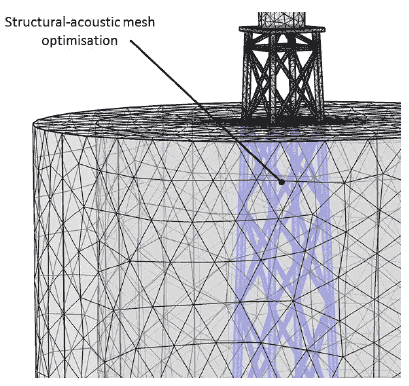
Figure 3-13 A maximum of 1.5 m mesh element size was applied to the foundation boundary of the structural - acoustic interaction to enable accurate calculation of the surface acceleration and resultant pressure waves propagating into the acoustic domain.
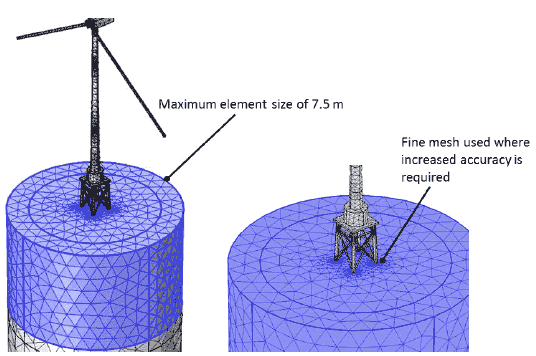
Figure 3-14 Acoustic domain mesh optimisation achieved by setting the maximum element size to 7.5 m.
3.6 Results
The average Sound Pressure Level calculated at the 30 m boundary is presented in Figure 3-15 for all three foundation types over the full frequency range. The following sections will look at each foundations results in more detail. Initial comparison shows peaks resulting from the three gear mesh frequencies of 30 Hz, 125 Hz and 600 Hz, the Poles and Stators at 78 Hz and 117 Hz respectively. Additional peaks occur at multiples, in particular around 200 Hz, 360 Hz and 560 Hz.
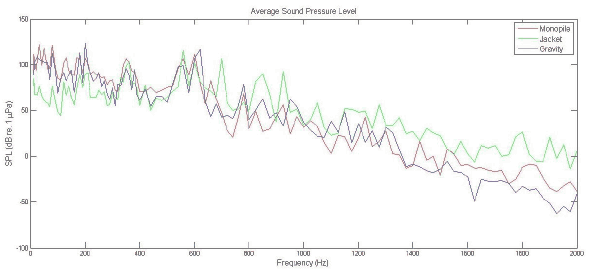
Figure 3-15 Comparison of acoustic response at the 30 m surface probe for the three different foundation types and a simulated wind speed of 15ms -1. It should be noted that the individual tones are modelled in the frequency domain and the results presented as lines for clarity. At high frequency (> 1700 Hz) the turbines produce negligible vibration and associated noise so that the modelled pressure variation is less than 1 μPa.
Peak SPL values calculated for a wind speed of 15 ms -1 emitted from the monopile are presented in Table 3-4 along with the likely source attributed to the resonance of the system at that frequency. SPL levels are in (dB re 1 µPa) hereafter denoted (dB), unless otherwise stated. They are taken from the peak values seen in Figure 3-16 which also presents the acoustic response for 10 ms -1 and 5 ms -1.
Table 3-4 Frequency of peak SPL levels emitted from the monopile as a 30 m average and also a maximum level reached within 5 m of the monopile at 15 ms -1. The 5m region is chosen to capture peak values that occur in localised areas close to the foundation. The specific distances at which these maxima occur vary due to the surface geometries of each foundation.
| Source | Frequency (Hz) | 30 m Average SPL (dB) | 5 m Maximum SPL (dB) |
|---|---|---|---|
| Gear Stage 1 | 31.5 | 121 | 143 |
| Gear Stage 1, 2 nd Multiple | 50 | 119 | 107 |
| Generator Poles | 80 | 123 | 142 |
| Gear Stage 2 Generator Stators | 125 | 122 | 147 |
| Gear Stage 1, 6 th Multiple | 180 | 109 | 136 |
| Gear Stage 1, 7 th Multiple | 200 | 112 | 137 |
| Generator Stators, 3 rd Multiple Gear Stage 2, 3 rd Multiple | 350 | 108 | 137 |
| Generator Poles, 7 th Multiple | 560 | 110 | 149 |
| Gear Stage 3 Generator Stators, 5 th Multiple | 600 | 114 | 135 |
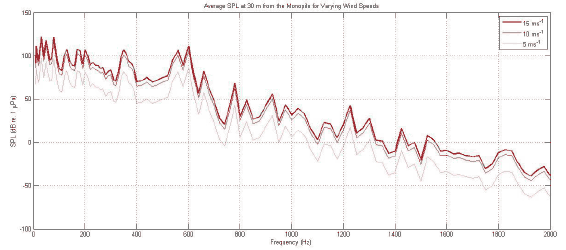
Figure 3-16 Near-field acoustic response of the monopile at wind speeds of 5, 10 and 15 ms -1.
Inspection of the near field soundscape, Figure 3-17, shows that the cylindrical spreading is immediately apparent at the lower frequencies, 31.5 Hz and 80 Hz, as anticipated from such a geometric construction with average SPL values of 121 dB and 123 dB respectively. At 31.5 Hz the radial dependency produces maximum values in the plane of the rotor whilst 80 Hz produces a more symmetric cylindrical spreading. Maximum values within 5 m of the monopile are 143 dB for 31.5 Hz and 142 dB for 80 Hz.
The cylindrical spreading at the higher frequency of 180 Hz exhibits more interference when spreading from the monopile, typical from the additional maxima / minima caused by a pulsing cylindrical source reflected from the water surface and seabed, with a 30 m average SPL of 109 dB and a 5 m maximum of 136 dB. The continued scatter resulting from higher frequencies produces comparable SPL levels at 600 Hz of 114 dB for the 30 m average and 135 dB for the 5 m maximum.
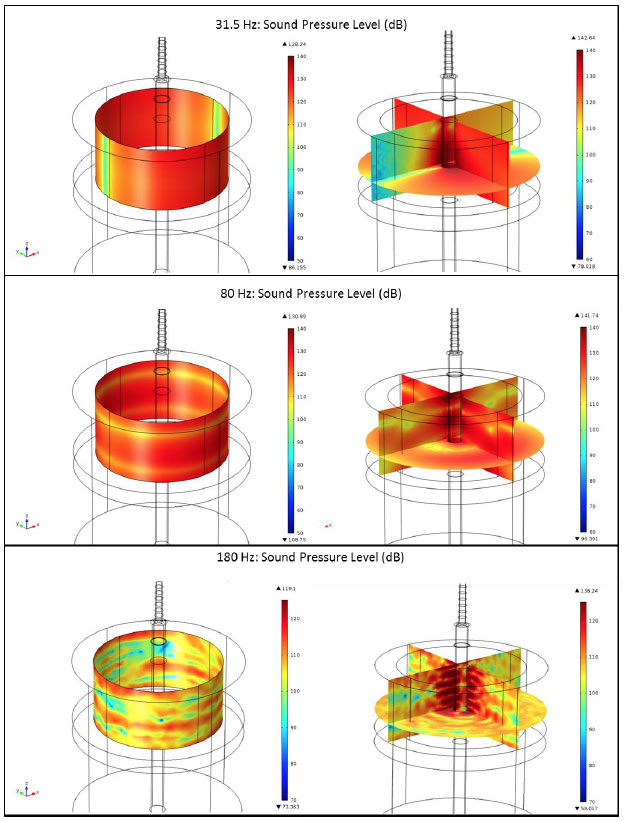
Figure 3-17 Acoustic soundscape from the monopile for 31.5, 80 and 180 Hz at 15 ms -1. The lower frequencies exhibit the cylindrical spreading with increasing constructive and destructive interference at the higher frequencies.
3.6.2 Gravity results
Peak SPL values calculated for a wind speed of 15 ms -1 emitted from the gravity base are presented in Table 3-5 along with the likely source attributed to the resonance of the system at that frequency. They are taken from the peak values seen in Figure 3-18 which also presents the acoustic response for 10ms -1 and 5ms -1.
Inspection of the near field soundscape, Figure 3-19, again shows cylindrical spreading is apparent at the lower frequencies, 31.5 Hz and 80 Hz with average SPL values of 105 dB and 111 dB respectively. At 31.5 Hz the radial dependency again produces maximum values in the plane of the rotor with additional constructive/destructive interference from the conical section of the gravity base whilst 80 Hz produces peak values in the plane of the wind direction (x-z plane). Maximum values within 5 m of the gravity base are 127 dB for 31.5 Hz and 134 dB for 80 Hz.
Table 3-5 Frequency of peak SPL levels emitted from the gravity base as a 30 m average and also a maximum level reached within 5 m of the gravity base at 15 ms -1.
| Source | Frequency (Hz) | 30 m Average SPL (dB) | 5 m Maximum SPL (dB) |
|---|---|---|---|
| Gear Stage 1 | 31.5 | 105 | 127 |
| Generator Poles | 80 | 111 | 134 |
| Gear Stage 2 Generator Stators | 125 | 94 | 125 |
| Gear Stage 1, 5 th Multiple Generator Poles, 2 nd Multiple | 150 | 96 | 106 |
| Gear Stage 1, 6 th Multiple | 180 | 116 | 133 |
| Gear Stage 1, 7 th Multiple | 200 | 128 | 152 |
| Generator Stators, 3 rd Multiple Gear Stage 2, 3 rd Multiple | 350 | 97 | 126 |
| Generator Poles, 7 th Multiple | 560 | 101 | 112 |
| Gear Stage 3 Gear Stage 2, 5 th Multiple | 620 | 116 | 143 |
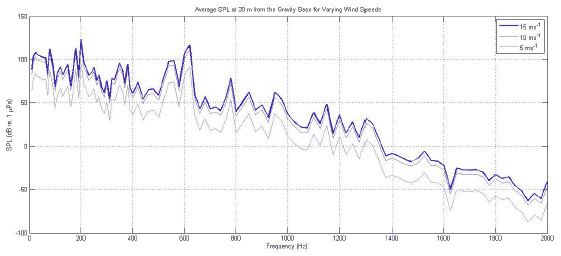
Figure 3-18 Near-field acoustic response of the gravity base at wind speeds of 5, 10 and 15ms -1.
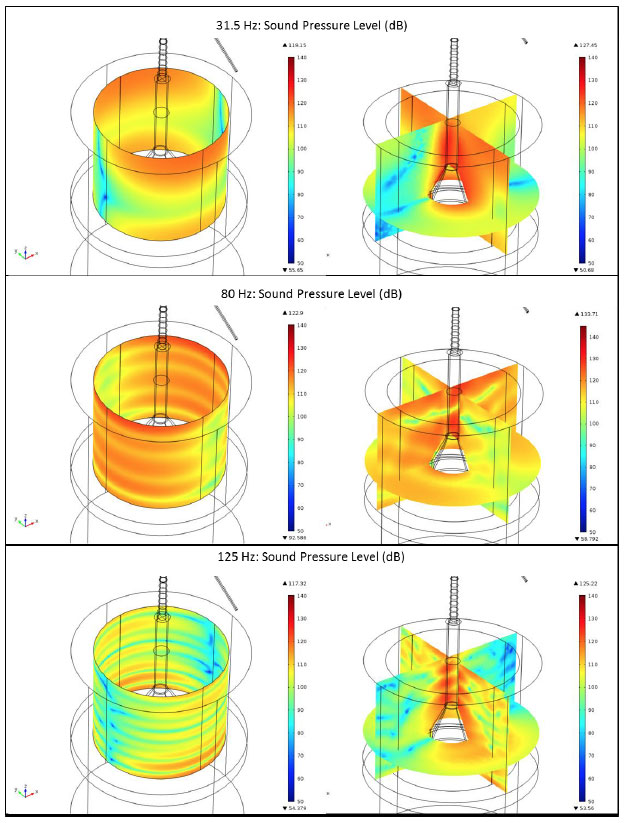
Figure 3-19 Acoustic soundscape from the gravity base for 31.5, 80 and 125 Hz at 15 ms -1. The lower frequencies exhibit the cylindrical spreading. At 125 Hz a similar response to the monopile can be seen emitting from the upper cylindrical section of the gravity base.
At the higher frequency of 125 Hz the acoustic soundscape exhibits more interference when spreading from the gravity base. The upper cylindrical section of the gravity base has a similar acoustic response to that of the monopile, here with lower levels of 94 dB for the 30 m average SPL and a 5 m maximum of 125 dB. The SPL again peaks near the Gear Stage 3 with a 30 m average of 116 dB at 620 Hz and 143 dB for the 5 m maximum.
Peak SPL values calculated for a wind speed of 15ms -1 emitted from the jacket foundation are presented in Table 3-6 along with the likely source attributed to the resonance of the system at that frequency. They are taken from the peak values seen in Figure 3-20 which also presents the acoustic response for 10ms -1 and 5ms -1.
Table 3-6 Frequency of peak SPL levels emitted from the jacket foundation as a 30 m average and also a maximum level reached within 5 m of the jacket at 15 ms -1.
| Source | Frequency (Hz) | 30 m Average SPL (dB) | 5 m Maximum SPL (dB) |
|---|---|---|---|
| Gear Stage 1 | 31.5 | 81 | 115 |
| Generator Poles | 80 | 76 | 116 |
| Gear Stage 2 Generator Stators | 120 | 82 | 127 |
| Gear Stage 1, 5 th Multiple Generator Poles, 2 nd Multiple | 140 | 76 | 113 |
| Gear Stage 1, 6 th Multiple | 180 | 93 | 125 |
| Gear Stage 1, 7 th Multiple | 200 | 94 | 123 |
| Generator Stators, 3 rd Multiple Gear Stage 2, 3 rd Multiple | 350 | 101 | 131 |
| Generator Poles, 7 th Multiple | 560 | 119 | 158 |
| Gear Stage 3 Generator Stators, 5 th Multiple | 600 | 101 | 136 |
| Generator Poles, 9 th Multiple Generator Stators, 6 th Multiple | 700 | 106 | 177 |
| Gear Stage 2, 7 th Multiple Generator Stators, 7 th Multiple | 850 | 90 | 179 |
| Generator Stators, 8 th Multiple Generator Poles and Stators, 2 nd Multiple | 925 | 92 | 191 |
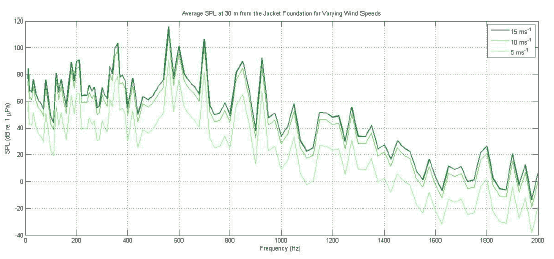
Figure 3-20 Near-field acoustic response of the jacket foundation at wind speeds of 5, 10 and 15ms -1.
The lower frequencies produce acoustic responses consistent with cylindrical spreading, Figure 3-21. Average SPL Values of 81 dB and 76 dB are reached at the 30 m surface probe for 31.5 Hz and 80 Hz respectively with maximum levels of 115 dB and 116 dB within 5 m of the jacket for these frequencies. The highest SPL calculated was for 560 Hz, with a 30 m average SPL of 119 dB and 5 m maximum of 158 dB. Furthermore higher frequencies produce significant SPL with 30 m averages of 106 dB at 700 Hz, 90 dB at 850 Hz and 92 dB at 925 Hz and 5 m maximum SPL values of 177 dB, 179 dB and 191 dB respectively.
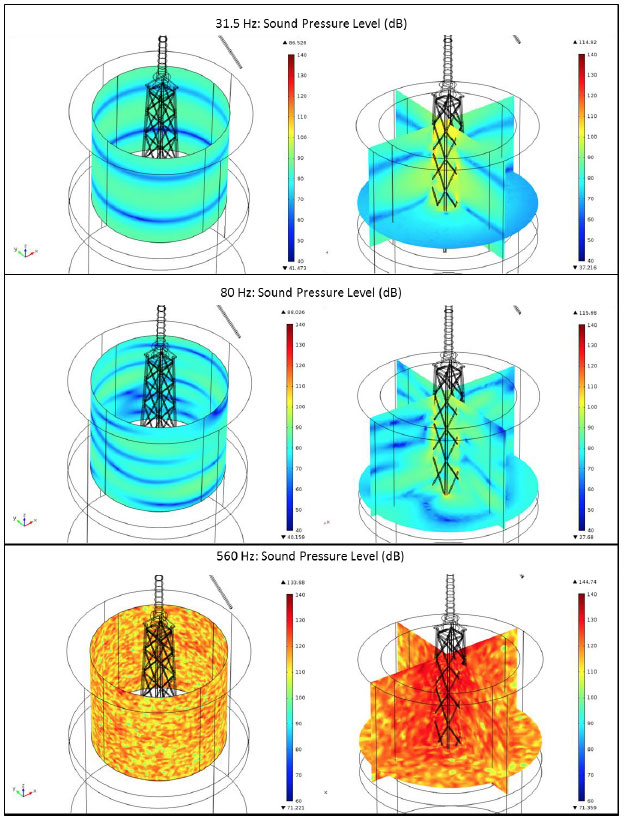
Figure 3-21 Acoustic soundscape from the jacket foundation for 31.5, 80 and 560 Hz at 15 ms -1. The lower frequencies exhibit the cylindrical spreading. The more complex lattice structure produces a noisier soundscape at the higher frequencies with greater SPL values achieved.
3.6.4 Comparison of peak SPL values
An initial comparison of the acoustic response for each of the three foundation types was presented in Figure 3-15. Inspection of the maximum SPL peaks and respective frequencies are summarised below in Table 3-7.
At frequencies lower than 180 Hz the monopile produces the largest amount of noise. Of the three foundation types the monopile continues to produce larger SPL values up to 500Hz. While the gravity base produces the largest average SPL values at the 30 m surface probe for 180 Hz and 200 Hz the peaks are sharper and the surrounding frequencies are of lower SPL values, Figure 3-15. Also apparent from Figure 3-15 is that around 600 Hz all three foundation types become comparable in average 30 m SPL with the trend of the jacket foundation rising to become the noisiest at frequencies greater than 700 Hz.
Generally the maximum level achieved within 5 m of the foundation coincides with the largest 30 m average level. The clear discrepancy from Table 3-7 being the jacket foundation at 120 Hz. Figure 3-22 presents the acoustic soundscape for the jacket at 120 Hz showing localised bursts of high sound intensity around the lattice but insufficient to propagate far from the foundation itself due to the small sizes of surface area producing these tones.
Table 3-7 Summary of near-field SPL values produced from each of the three foundation types at 15 ms -1. The frequency at which the 30 m average SPL value peaks is given in the first column. Where foundation types have similar peaks the corresponding frequency is denoted (M) Monopile, (G) Gravity Base, (J) Jacket. The monopile typically produces the largest noise levels at the lower frequencies. The jacket produces the largest noise levels at the higher frequencies.
| Monopile | Gravity Base | Jacket | ||||
|---|---|---|---|---|---|---|
| Frequency (Hz) | 30 m Average SPL (dB) | 5 m Max SPL (dB) | 30 m Average SPL (dB) | 5 m Max SPL (dB) | 30 m Average SPL (dB) | 5 m Max SPL (dB) |
| 31.5 | 121  |
143  |
105 | 127 | 81 | 115 |
| 80 | 123  |
142  |
111 | 134 | 76 | 116 |
| 120 | 100  |
123 | 92 | 117 | 82 | 127  |
| 125 | 122  |
147  |
94 | 125 | 78 | 131 |
| 180 | 109 | 136  |
116  |
133 | 93 | 125 |
| 200 | 112 | 137 | 128  |
152  |
94 | 123 |
| 350 | 108  |
137  |
97 | 126 | 101 | 131 |
| 470(G,J) / 480(M) | 74  |
99 | 71 | 112  |
67 | 99 |
| 560 | 110 | 149 | 101 | 139 | 119  |
158  |
| 600(M,J) / 620(G) | 114 | 135 | 116  |
143  |
101 | 136 |
| 660(M) / 680(G) / 700(J) | 85 | 158 | 57 | 129 | 106  |
177  |
| 825(M) / 850(G,J) | 53 | 152 | 62 | 159 | 90  |
179  |
| 925(M,J) / 950G) | 61 | 171 | 62 | 166 | 92  |
191  |
 The largest 30m Average SPL value achieved by any of the three foundation types.
 The largest SPL value achieved within 5 m of the foundation by any of the three foundation types.
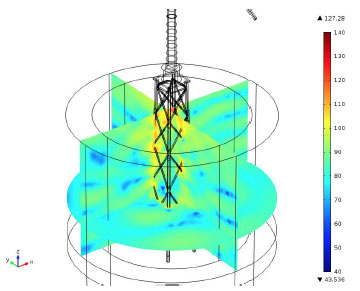
Figure 3-22 Acoustic soundscape of the jacket foundation at 120 Hz and 15 ms -1. High intensity bursts of noise are present at localised points of the jacket lattice. The intensity of which is insufficient to propagate far from the structure due to the small surface area producing the noise.
Contact
There is a problem
Thanks for your feedback