Planning performance statistics: 2018-2019 midyear
Latest statistics on planning decision-making and timescales for April to September 2018 (quarters one and two), as well as historic data going back to quarter one of 2014-2015.
This document is part of a collection
5. Legal Agreements
The timescales for applications with legal agreements are dependent on the nature of the application, the particular complexities involved and the willingness of both the applicant and the planning authority to progress the matter at pace.
The figures exclude applications with processing agreements.
5.1 Local developments with Legal Agreements
In the first six months of 2018/19 there were 139 applications for local developments where planning authorities had planning/legal agreements in place, 37 fewer than in the same period in the previous year. The average time taken to make decisions on these applications was 31.4 weeks, two weeks slower than the 29.4 weeks for the same period in 2017/18.
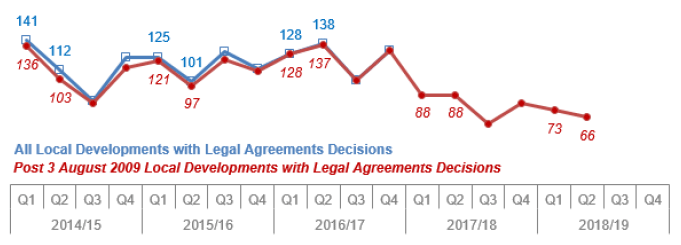
There were 73 applications with planning/legal agreements for local developments decided in quarter one of 2018/19, 15 (17.0%) fewer than in the equivalent quarter in the previous year. The average decision time was 31.6 weeks, more than four weeks slower than the 27.0 weeks for quarter one in the previous year. The average decision time was influenced by a number of applications with long decision times including four with times of more than two years (Midyear, 2018/19 – Table 3).
There were 66 applications with planning/legal agreements for local developments decided in quarter two of 2018/19, 22 (25.0%) fewer than in the equivalent quarter in the previous year. The average decision time was 31.2 weeks, slightly quicker than the 31.7 weeks for quarter two in the previous year (Midyear, 2018/19 – Table 3). The average decision time was influenced by a number of applications with long decision times including three with times of more than two years, one of which took over seven years.
Chart 30: Local developments with Legal Agreements: Number of decisions

Chart 31: Local developments with Legal Agreements: Average decision time (weeks)

2016/17 Q4 figures were revised in July 2018
5.2 Major developments with Legal Agreements
In the first six months of 2018/19 there were 40 applications for major developments where planning authorities had planning/legal agreements in place, seven fewer than in the same period in the previous year. The average time taken to make decisions on these applications was 53.4 weeks, more than ten weeks slower than the 43.1 weeks for the same period in 2017/18.
There were 24 major development applications with planning/legal agreements decided in quarter one of 2018/19, three (14.3%) more than in the same quarter in the previous year. The average decision time was 46.8 weeks, more than three weeks slower than the 43.3 weeks for quarter one in the previous year. The average decision time was influenced by a number of applications with long decision times including four with times of more than one year, the longest taking 4.5 years (Midyear, 2018/19 – Table 2).
There were 16 major development applications with planning/legal agreements decided in quarter two of 2018/19, ten (38.5%) fewer than in the same quarter in the previous year. The average decision time was 63.4 weeks, more than 20 weeks slower than the 42.9 weeks for quarter two in the previous year. The average decision time was influenced by a number of applications with long decision times including seven with times of more than one year, the longest taking 2.3 years (Midyear, 2018/19 – Table 2).
Chart 32: Major developments with Legal Agreements: Number of decisions

Chart 33: Major developments with Legal Agreements: Average decision time (weeks)

The 2015/16 Q4 All Applications figure was revised in January 2018
Contact
Email: Planning Statistics
There is a problem
Thanks for your feedback