Planning performance statistics: annual report 2018-2019
Annual statistics on planning decision-making and timescales for 2012-2013 to 2018-2019, based on quarterly data collected by the Scottish Government from Local and Planning Authorities as part of the Planning Performance Framework (introduced in 2012).
This document is part of a collection
5. Applications by Development Type
5.1. Local Developments
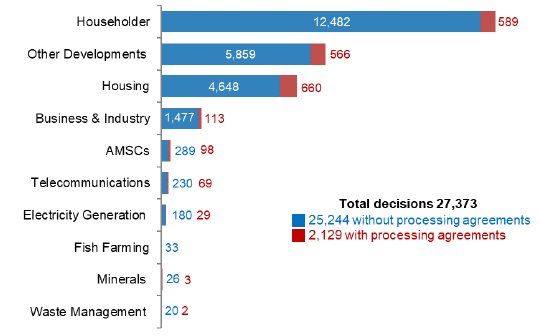
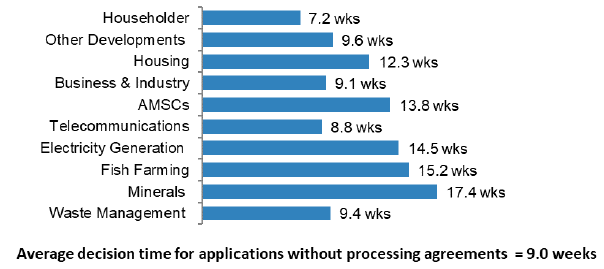
The average decision time for 25,244 (post 3rd August 2009) local applications not subject to processing agreements in 2018/19 was 9.0 weeks. The number of decisions and average decision times vary between types of development (Tables 1 and 2).
In addition, there were 2,129 local developments decided in 2018/19 that had processing agreements in place. Developments with processing agreements are not included in average time calculations.
The largest share of local developments is for householder developments (almost 50%) and these have the shortest average decision time (7.2 weeks). Mineral applications (0.1% of all local decisions) have the longest average decision time (17.4 weeks).
Chart 37: Local Developments: Number of decisions

Chart 38: Local Developments: Average decision time (weeks)

Table 1: Post 3 August 2009 Applications: Local Developments: Annual average decision times by Development Type1
| Post-3rd August Local Developments |
2018/19 | 2017/18 | 2016/17 | 2015/16 | 2014/15 | 2013/14 | 2012/13 | |||||||
|---|---|---|---|---|---|---|---|---|---|---|---|---|---|---|
| Number of decisions | Average decision time (weeks) | Number of decisions | Average decision time (weeks) | Number of decisions | Average decision time (weeks) | Number of decisions | Average decision time (weeks) | Number of decisions | Average decision time (weeks) | Number of decisions | Average decision time (weeks) | Number of decisions | Average decision time (weeks) | |
| Householder | 12,482 | 7.2 | 12,861 | 7.3 | 13,400 | 7.3 | 13,641 | 7.4 | 14,115 | 7.5 | 13,904 | 7.7 | 13,446 | 8.0 |
| Other Developments | 5,859 | 9.6 | 5,981 | 9.9 | 5,919 | 10.0 | 6,126 | 10.3 | 6,099 | 10.4 | 6,258 | 10.5 | 5,822 | 11.3 |
| Housing | 4,648 | 12.3 | 4,768 | 12.2 | 4,899 | 12.7 | 5,590 | 13.7 | 5,807 | 14.5 | 5,762 | 15.2 | 5,563 | 17.2 |
| Business & Industry | 1,477 | 9.1 | 1,609 | 9.5 | 1,738 | 9.3 | 1,941 | 10.4 | 2,257 | 10.7 | 2,370 | 11.1 | 2,531 | 11.8 |
| Telecommunications | 230 | 8.8 | 504 | 8.7 | 457 | 8.1 | 441 | 7.9 | 416 | 7.6 | 404 | 8.5 | 301 | 8.5 |
| AMSCs | 289 | 13.8 | 284 | 13.9 | 294 | 14.5 | 319 | 13.0 | 318 | 14.8 | 302 | 17.4 | 255 | 16.3 |
| Electricity Generation | 180 | 14.5 | 123 | 13.3 | 178 | 19.2 | 561 | 17.4 | 626 | 22.4 | 861 | 23.1 | 1,247 | 21.2 |
| Fish Farming | 33 | 15.2 | 56 | 9.3 | 44 | 8.5 | 84 | 9.4 | 53 | 13.3 | 63 | 12.5 | 43 | 10.6 |
| Minerals | 26 | 17.4 | 17 | 27.1 | 28 | 19.9 | 39 | 35.0 | 25 | 17.7 | 47 | 15.8 | 35 | 26.9 |
| Waste Management | 20 | 9.4 | 17 | 16.6 | 29 | 11.6 | 22 | 10.8 | 23 | 17.8 | 55 | 19.4 | 89 | 16.3 |
| Total | 25,244 | 9.0 | 26,220 | 9.0 | 26,986 | 9.2 | 28,764 | 9.7 | 29,739 | 10.1 | 30,026 | 10.6 | 29,332 | 11.4 |
Table 2: All Applications: Local Developments: Annual average decision times by Development Type1,2
| All Applications Local Developments |
2018/19 | 2017/18 | 2016/17 | 2015/16 | 2014/15 | 2013/14 | 2012/13 | |||||||
|---|---|---|---|---|---|---|---|---|---|---|---|---|---|---|
| Number of decisions | Average decision time (weeks) | Number of decisions | Average decision time (weeks) | Number of decisions | Average decision time (weeks) | Number of decisions | Average decision time (weeks) | Number of decisions | Average decision time (weeks) | Number of decisions | Average decision time (weeks) | Number of decisions | Average decision time (weeks) | |
| Householder | 13,400 | 7.3 | 13,644 | 7.5 | 14,116 | 7.5 | 13,904 | 7.7 | 13,450 | 8.1 | ||||
| Other Developments | 5,920 | 10.0 | 6,131 | 10.5 | 6,102 | 10.5 | 6,264 | 10.8 | 5,833 | 11.7 | ||||
| Housing | 4,901 | 12.8 | 5,616 | 14.4 | 5,836 | 15.3 | 5,831 | 17.5 | 5,671 | 20.9 | ||||
| Business & Industry | 1,738 | 9.3 | 1,944 | 11.2 | 2,259 | 10.9 | 2,385 | 12.9 | 2,548 | 13.0 | ||||
| Telecommunications | 457 | 8.1 | 441 | 7.9 | 416 | 7.6 | 404 | 8.5 | 301 | 8.5 | ||||
| AMSCs | 294 | 14.5 | 319 | 13.0 | 319 | 15.1 | 303 | 18.0 | 255 | 16.3 | ||||
| Electricity Generation | 178 | 19.2 | 561 | 17.4 | 626 | 22.4 | 863 | 23.5 | 1,251 | 21.7 | ||||
| Fish Farming | 44 | 8.5 | 84 | 9.4 | 53 | 13.3 | 63 | 12.5 | 43 | 10.6 | ||||
| Minerals | 28 | 19.9 | 40 | 35.1 | 25 | 17.7 | 49 | 22.3 | 36 | 31.6 | ||||
| Waste Management | 30 | 15.5 | 22 | 10.8 | 23 | 17.8 | 57 | 26.8 | 95 | 28.7 | ||||
| Total | 26,990 | 9.2 | 28,802 | 10.0 | 29,775 | 10.3 | 30,123 | 11.3 | 29,483 | 12.4 | ||||
1. Figures do not include applications subject to processing agreements
2. The analysis in Sections 2 to 5 covers applications validated in the current planning system, post 3rd August 2009. For applications decided prior to quarter one 2017/18, where appropriate, figures are provided for both post 3rd August 2009 applications and all applications including legacy cases. From quarter one 2017/18, because of the limited number of legacy cases still being processed, figures are only shown for applications validated post 3rd August 2009. Analysis of the limited number of decided legacy cases is provided separately in Section 11.
5.2. Major Developments
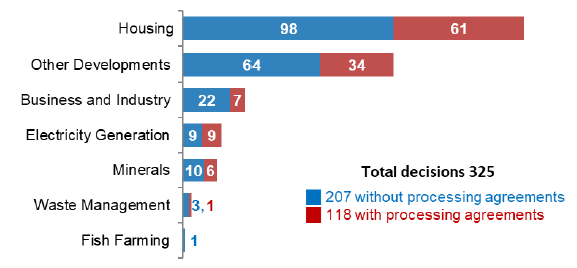
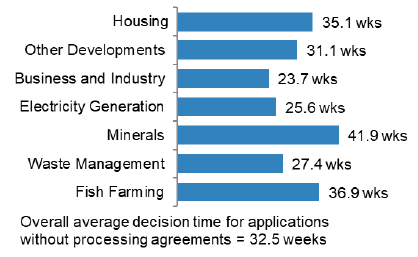
The average decision time for 207 (post 3rd August 2009) major applications not subject to processing agreements in 2018/19 was 32.5 weeks. The number of decisions and average decision times vary between types of development (Tables 3 and 4).
In addition, there were 118 major developments decided in 2018/19 that had processing agreements in place. Developments with processing agreements are not included in average time calculations.
Almost half (49%) of major developments are for housing developments, these have an average decision time of 35.1 weeks.
The shortest average decision time of 23.7 weeks is for Business and Industry developments, the longest average decision time is for Mineral applications (41.9 weeks).
Chart 39: Major Developments by Development Type: Number of decisions

Chart 40: Major Developments by Development Type: Average decision time (weeks)

Table 3: Post 3 August 2009 Applications: Major Developments: Annual average decision times by Development Type1
| Post-3rd August Major Developments |
2018/19 | 2017/18 | 2016/17 | 2015/16 | 2014/15 | 2013/14 | 2012/13 | |||||||
|---|---|---|---|---|---|---|---|---|---|---|---|---|---|---|
| Number of decisions | Average decision time (weeks) | Number of decisions | Average decision time (weeks) | Number of decisions | Average decision time (weeks) | Number of decisions | Average decision time (weeks) | Number of decisions | Average decision time (weeks) | Number of decisions | Average decision time (weeks) | Number of decisions | Average decision time (weeks) | |
| Housing | 98 | 35.1 | 116 | 38.2 | 108 | 43.4 | 95 | 40.6 | 113 | 41.3 | 117 | 41.9 | 76 | 40.1 |
| Other Developments | 64 | 31.1 | 83 | 30.6 | 94 | 30.4 | 108 | 25.1 | 101 | 28.7 | 105 | 25.9 | 66 | 34.3 |
| Business & Industry | 22 | 23.7 | 17 | 25.5 | 26 | 33.2 | 23 | 19.9 | 39 | 33.1 | 41 | 26.6 | 45 | 22.8 |
| Electricity Generation | 9 | 25.6 | 9 | 36.5 | 10 | 32.6 | 16 | 31.7 | 19 | 53.6 | 27 | 58.4 | 24 | 50.7 |
| Minerals | 10 | 41.9 | 8 | 23.9 | 5 | 30.0 | 16 | 33.6 | 16 | 52.1 | 13 | 20.6 | 21 | 46.6 |
| Waste Management | 3 | 27.4 | 5 | 14.0 | 3 | 18.6 | 9 | 22.4 | 9 | 18.4 | 7 | 23.7 | 5 | 22.3 |
| Fish Farming | 1 | 36.9 | 0 | - | 0 | - | 1 | 18.0 | 1 | 31.6 | 0 | - | 1 | 4.4 |
| Total | 207 | 32.5 | 238 | 33.6 | 246 | 36.4 | 268 | 31.0 | 298 | 36.6 | 310 | 34.6 | 238 | 36.3 |
Table 4: All Applications: Major Developments: Annual average decision times by Development Type1,2
| All Applications Major Developments |
2018/19 | 2017/18 | 2016/17 | 2015/16 | 2014/15 | 2013/14 | 2012/13 | |||||||
|---|---|---|---|---|---|---|---|---|---|---|---|---|---|---|
| Number of decisions | Average decision time (weeks) | Number of decisions | Average decision time (weeks) | Number of decisions | Average decision time (weeks) | Number of decisions | Average decision time (weeks) | Number of decisions | Average decision time (weeks) | Number of decisions | Average decision time (weeks) | Number of decisions | Average decision time (weeks) | |
| Housing | 108 | 43.4 | 105 | 52.1 | 125 | 54.1 | 147 | 69.9 | 104 | 74.8 | ||||
| Other Developments | 96 | 30.3 | 111 | 26.3 | 103 | 32.9 | 115 | 38.7 | 73 | 46.2 | ||||
| Business & Industry | 26 | 33.2 | 23 | 19.9 | 41 | 41.3 | 45 | 39.8 | 51 | 56.2 | ||||
| Electricity Generation | 10 | 32.6 | 17 | 53.7 | 21 | 69.1 | 27 | 58.4 | 28 | 64.4 | ||||
| Minerals | 6 | 39.0 | 18 | 41.8 | 17 | 70.0 | 15 | 59.0 | 23 | 47.4 | ||||
| Waste Management | 3 | 18.6 | 9 | 22.4 | 10 | 24.8 | 7 | 23.7 | 7 | 87.4 | ||||
| Fish Farming | 0 | - | 1 | 18.0 | 1 | 31.6 | 0 | - | 1 | 4.4 | ||||
| Total | 249 | 36.4 | 284 | 37.8 | 318 | 46.4 | 356 | 53.8 | 287 | 61.1 | ||||
1. Figures do not include applications subject to processing agreements.
2. The analysis in Sections 2 to 5 covers applications validated in the current planning system, post 3rd August 2009. For applications decided prior to quarter one 2017/18, where appropriate, figures are provided for both post 3rd August 2009 applications and all applications including legacy cases. From quarter one 2017/18, because of the limited number of legacy cases still being processed, figures are only shown for applications validated post 3rd August 2009. Analysis of the limited number of decided legacy cases is provided separately in Section 11.
Contact
Email: planstats@gov.scot
There is a problem
Thanks for your feedback