Housing Statistics 2020 & 2021: Key Trends Summary
Annual statistics up to 31 March 2021 on total new housing supply in Scotland across all sectors, along with information on various elements of local authority housing such as stock, lettings, house sales, evictions, housing lists, and housing for older people and people with disabilities.
This document is part of a collection
Local Authority Vacant Stock
As at 31st March 2021, local authorities reported 9,813 units of vacant stock, an increase of 18% (1,482 units) on the 8,331 units in the previous year.
There were increases in the number of vacant units awaiting demolition (an increase of 245 units, or 12%, from 2,069 to 2,314) and vacant normal letting stock (an increase of 883, or 26%, from 3,454 to 4,337), with vacant units in low demand areas dropping by 20 from 529 to 509 and vacant units used as temporary accommodation for the homeless increasing by 5 from 780 to 785. Although vacant units used as temporary accommodation for the homeless increased 64% (304 units) between 2019 and 2020. There was also an increase in the number of vacant units as part of a modernisation programme (an increase of 369, or 25%, from 1,499 to 1,868).
Local authority dwellings can be vacant for a variety of reasons, such as being part of a planned disposal or modernisation/repair programme, or being in low demand areas. Of the 9,813 units, 24% were awaiting demolition or sale, 5% were in a low demand area, 19% were part of a modernisation programme, and a further 8% were used as temporary accommodation for the homeless. Of the vacant stock, 44% was normal letting stock or other vacant stock, which represents 1% of all local authority normal letting stock.
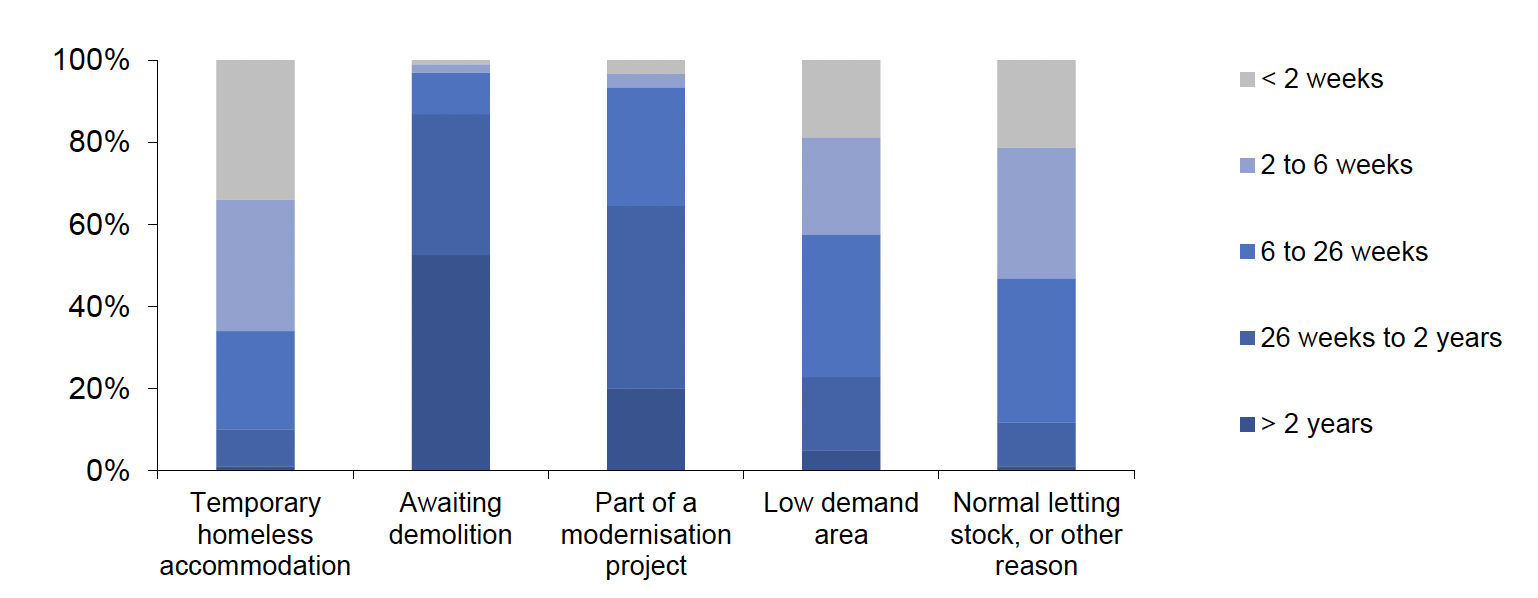
Chart 9 below illustrates that the length of time that properties have been vacant is closely related to the reason for the vacancy. Normal letting stock, or temporary homeless accommodation tends to be empty for less time than other types of vacant stock. For example, at March 2021 20% of vacant normal letting stock had been vacant for less than two weeks, and only 1% had been vacant for over two years. This compares to just over half (52%) of vacant stock awaiting demolition which was vacant for over two years, and just 1% vacant for less than two weeks.
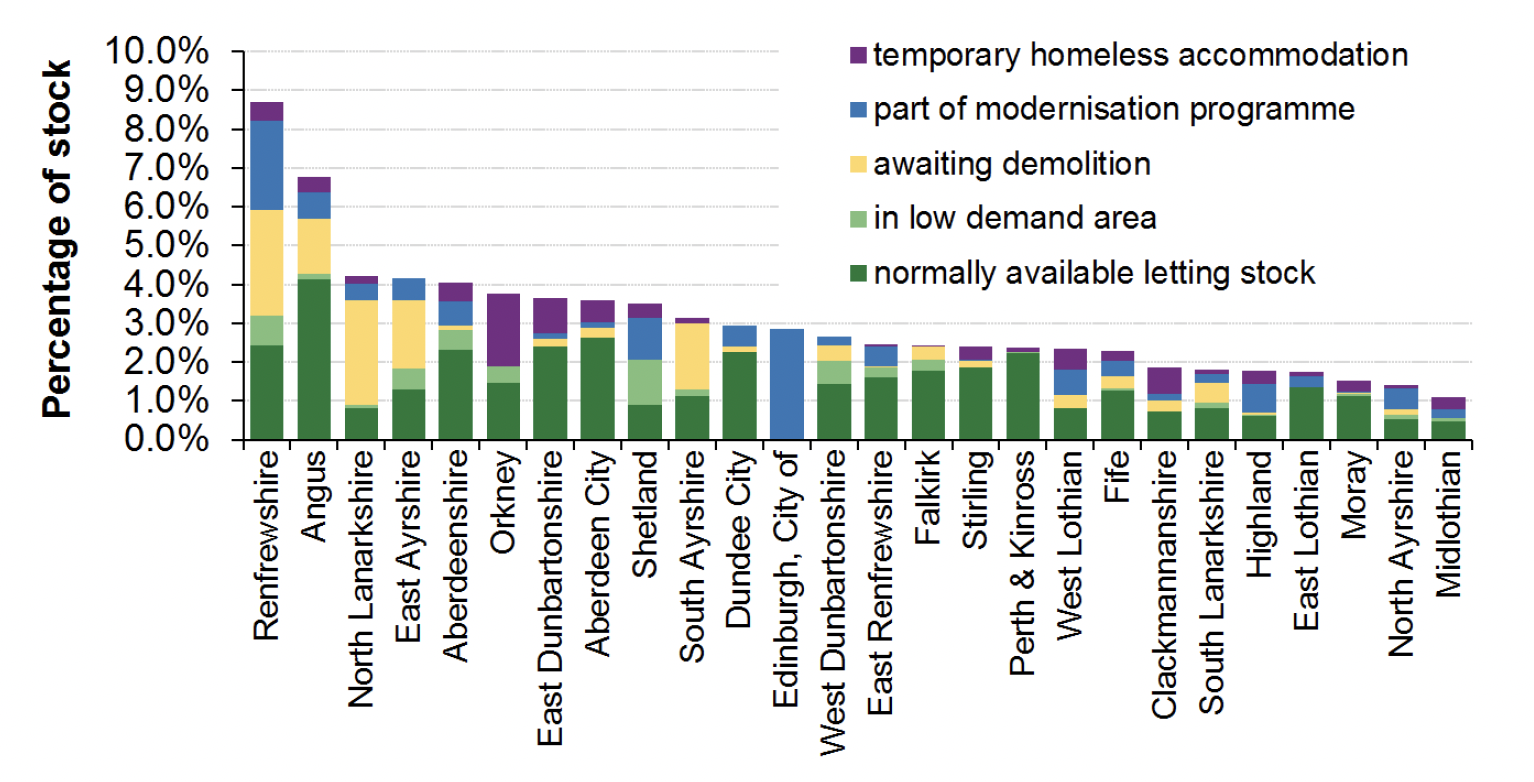
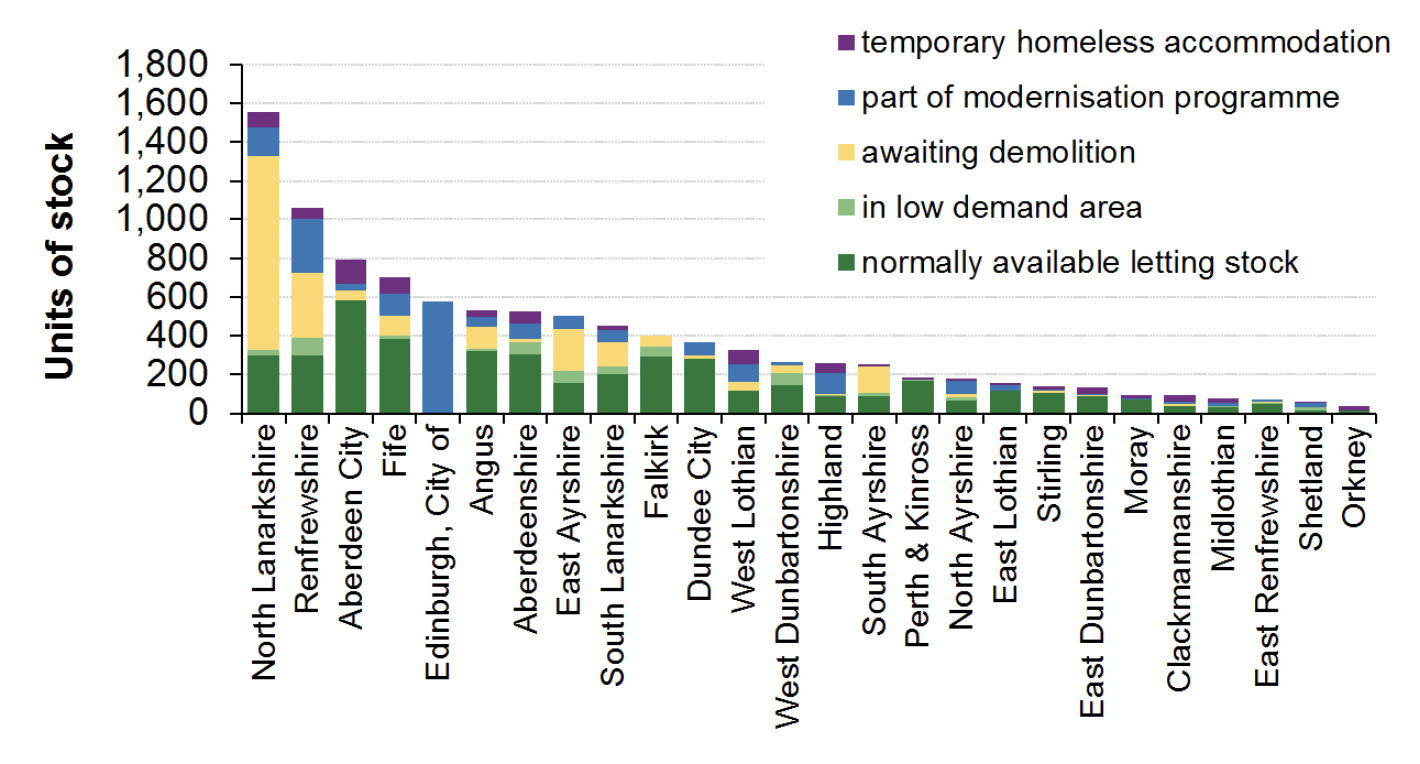
Vacant stock in each local authority area (except those which have transferred their social housing stock) is shown in Chart 10a and Chart 10b. Chart 10a shows vacant stock, by reason for vacancy, as a proportion of all local authority housing stock. This shows that total vacant stock as a proportion of all stock varied between 8.7% in Renfrewshire and 1.1% in Midlothian. Chart 10b is based on the same data but presents absolute numbers of units of vacant stock instead of proportions. This shows that total vacant stock varied between 1,555 units in North Lanarkshire to 36 units in Orkney.
Further detailed figures are available in the public authority vacant stock Excel webtables
Contact
There is a problem
Thanks for your feedback