Children's development at the start of school in Scotland and the progress made during their first school year: An analysis of PIPS baseline and follow-up assessment data
This report shows the results of analysis on the starting points and progress of children in Scotland in Primary 1 in early maths, early literacy and non-cognitive development and behaviour.
4. Children's development at the start of Primary 1 and progress to the end of academic year 2012/13
4.1 The content of the PIPS assessment
General information about the PIPS assessment is available on the Centre for Evaluation and Monitoring's website[3]. In short, the assessment has two main parts: the first assesses cognitive development; and the second personal and social development. The first part is designed to assess those aspects which are the best predictors of later success or difficulty (Tymms, 1999a and 1999b; Tymms, Brien, Merrell et al, 2003; Tymms, Merrell, Henderson et al, 2012). PIPS is a computer-delivered assessment. The content of the cognitive part is extensive, but no individual child sees all of it, which means that a very wide range of children can be assessed in an efficient, reliable and enjoyable way. The cognitive part is made up of sections which assess Early Mathematics, Early Reading, Picture Vocabulary and Phonological Awareness. Children are assessed on a one-to-one basis within the first few weeks of them starting school, usually by their class teacher but sometimes by a teaching assistant or other adult. The computer asks the child questions which require the child to respond either verbally or by pointing to the screen. The teacher records the child's answers as correct or incorrect on-screen. Each section begins at a very easy level and the questions increase in difficulty. When the child starts to make mistakes, the assessment moves on to the next section, beginning once again at an easy level. The cognitive section usually takes between 15 to 20 minutes per child. At the end of Primary 1, children are assessed once again. Rather than starting at the very beginning, the assessment takes account of where a child started to falter in the start of year assessment and resumes at that point.
The constructs assessed in the cognitive part of PIPS are shown in Figure 7.
Figure 7: Constructs assessed in the cognitive part of PIPS
| Construct | Description |
|---|---|
| Writing | Writing - the child is asked to write his/her own name and the quality of writing is scored against examples |
| Vocabulary | Vocabulary - the child is asked to identify objects embedded within a picture |
| Ideas About Reading | Ideas about reading - assesses many of the ideas found in Marie Clay's Concepts about Print (Clay 1972) |
| Phonological awareness | Repeating Words - the child hears a word and is asked to repeat it |
| Rhyming Words - the child selects a word to rhyme with a target word from a choice of three options | |
| Letters | Letter identification - a fixed order of mixed upper and lower case letters |
| Early Reading | Word recognition and reading This starts with word recognition and moves on to simple sentences that the child is asked to read aloud. The words within these sentences are high frequency and common to most reading schemes. This is followed by two more difficult comprehension exercises called 'Walking to school' and 'Cats' which require the child to read a passage and at certain points select one word from a choice of three that best fits that position in the sentence |
| Ideas About Mathematics | Ideas about mathematics - assessment of understanding of the vocabulary associated with mathematical concepts |
| Counting | Counting and numerosity - the child is asked to count four objects. These disappear from the screen and then the child is asked how many objects they saw. This is repeated with seven objects |
| Digits | Digit identification - single, two-digits and three-digits |
| Shapes | Identification of a variety of geometric shapes |
| Number | Number manipulation - the child is asked how many more or less a number is than a target |
| Sums A | (Informal) Sums - addition and subtraction problems presented without symbols |
| Sums B | (Formal) More difficult mathematics problems including sums presented with formal notation |
The personal and social development is completed by teachers on the basis of their observations of their pupils' behaviour in the school setting. It includes 11 scales as shown in Figure 8. See Appendix B for full descriptors of all scales.
Figure 8: Personal and social development scales of PIPS
| Construct | Description |
|---|---|
| Adjustment to the school setting | Comfortable - Is the child comfortable upon separation from main carer at the start of the day and do they cope easily with transitions within the school day? |
| Independence - Level of support and guidance needed for personal care and activities | |
| Personal | Confidence |
| Concentration on self-directed activities | |
| Concentration of teacher-directed activities | |
| Actions - Consideration of others | |
| Social | Relationships with peers |
| Relationships with adults | |
| Rules - takes notice of rules | |
| Cultural awareness | |
| Communication |
Each scale has five points, accompanied by a description . The teacher rates each child on the description that most closely matches his/her behaviour.
4.2 Item maps at the start of Primary 1
A statistical method called Rasch measurement was used to transform the raw scores of children into measures on an objective interval scale. This interval scale can be thought of as a ruler upon which an estimate of each child's developed ability can be placed as can the difficulty level of each of the questions (referred to as 'items' in this section) in the assessment. The unit of measurement of this 'ruler' is referred to as a logit.
Item maps of children's cognitive development were then constructed. These are explained below.
4.2.1 The full PIPS cognitive development scale
Figure C-1 in Appendix C shows an item map which includes all of the constructs assessed in the cognitive development part of PIPS. Children's developed ability levels and the difficulty of all of the questions are placed on the same logit scale. The children's developed ability levels are shown on the left side of the scale under the 'Person' column. The 'Measure' column at the left side of the map shows the logit scale which, in this instance, ranges from -6 to +7. The difficulty of the questions is shown in the right side of the map. The higher the value on the logit scale, the more able the child and also the more difficult the item.
The 'M's on the scale denote the mean score of the children and the mean difficulty of the cognitive development scale. Looking at the item map, we can see that children's developed ability levels are 'normally' distributed: There are a few children of very low and very high ability, with the majority in the middle, average, range. The mean ability of the children is very close to the mean difficulty of the items, which suggests that the assessment was of an appropriate difficulty. It was neither too easy for most children nor too difficult.
Each of the questions in the assessment has an ID, and these are presented in the item map. The first part of the question ID generally corresponds to the names of the constructs listed in Figure 7, which enables us to see what area they are assessing. The most difficult items are within the Sums B and Number sections, and the 'Walking to school' and 'Cats' sections of the reading comprehension. Questions such as 'What is twice three, doubled?' and 'What is 21 more than 32?'. Virtually no children were able to answer these at the start of Primary 1 and with the adaptive nature of the assessment, they would not have been presented with them.
At the easier end of the scale, most children were able to identify items which were assessing their vocabulary acquisition such as 'carrots', 'a bowl' and 'some cherries' from within a picture of a kitchen, to differentiate between the biggest item from a set of three and the smallest, and to identify simple 2D shapes.
Children within the average range of ability were typically able to identify several letters, identify a microscope within a scene from the vocabulary section, identify single digits and answer early mathematics questions such as 'here are six ice creams, if I took three away, how many would be left?'.
This item map has particular formative value for teachers when considering what children know and can do at the start of Primary 1, providing information about the learning progression so that they can pitch their teaching appropriately. At policy level, such an item map could make an important contribution to curriculum design, providing information about the order in which children of this age acquire conceptual understanding in various areas.
4.2.2 Early mathematics
Figure C-2 of Appendix C is an item map which shows more clearly the early mathematics scale.
The children's abilities were normally distributed, which means that the majority of children's scores were close to the average and that fewer and fewer scores appeared at higher and lower values. In terms of what children know and can do, the vast majority were able to identify the biggest and smallest cats from a picture containing three cats. They could identify a star and a circle from a choice of differently shaped balloons, count up to four objects and identify the number 1. At the top end of the ability range, some children entering Primary 1 were able to identify three-digit numbers and perform arithmetic such as 15 + 21. This illustrates the very wide range of children's abilities and mathematical conceptual understanding for which Primary 1 class teachers need to cater.
4.2.3 Early reading
Once again, a normal distribution of abilities was found. On the early reading scale, children at the lower end of the ability range were able to distinguish between someone who is reading and someone who is writing in a picture scene of a classroom. They were able to repeat the word 'stop'. On average, children starting Primary 1 were able to identify several letters of the alphabet, repeat words with three syllables, and identify rhyming words when presented to them in a multiple choice format with sounds accompanied by pictures (e.g. Listen to these words - sun, fish, run, knife - which word rhymes with sun?). The most able children could recognise words from a multiple choice format, and decode words such as 'shop' 'always', 'night' and 'play' in order to read sentences aloud.
4.2.4 Picture vocabulary
The item map (Figure C-4 of Appendix C) indicates that several of the vocabulary items in this section were very easy for the majority of children. Nevertheless, the vocabulary of a small number of children was quite limited, identifying only very common objects such as cherries, a knife, a fork and a kite. At the upper end of the ability range, a small number of children had a much more extensive acquisition of vocabulary as indicated by their ability to identify a yacht and some cosmetics.
4.2.5 Phonological awareness
The phonological awareness scale includes just 17 items. The rhyming words section is abbreviated to 'Rhy' and the repeating words section abbreviated to 'Rep' in the item map in the Appendix C. Like the picture vocabulary section, many of the questions were very easy for the majority of children, however, some children were not able to repeat words accurately or understand the concept of rhyming. It is important for teachers to identify these children and intervene at an early stage to improve their phonological awareness, which is such an important precursor of reading.
4.3 Differences between groups on the cognitive measures at the start of Primary 1
Before investigating differences between groups, the strength of the relationship between the areas of development for the full sample is explored. A score for each pupil was calculated by totalling the number of items which they answered correctly within a sub-scale. The total of all sub-scales made up a pupil's total score. The correlations between sub-scales[4] are shown in Figure 9. These correlations show how strong the relation is between pupils' scores on, for example, early reading and early mathematics.
Figure 9: Correlations between the scales for children in Scotland at the start of Primary 1
| Total | Early Reading | Early Mathematics | Vocabulary | Phonological Awareness | |
|---|---|---|---|---|---|
| Total | 1 | .90 | .88 | .60 | .65 |
| Early Reading | .90 | 1 | .71 | .42 | .45 |
| Early Mathematics | .88 | .70 | 1 | .47 | .52 |
| Picture Vocabulary | .60 | .42 | .47 | 1 | .45 |
| Phonological Awareness | .65 | .45 | .52 | .45 | 1 |
The correlations are based on 6,622 cases. All correlations were significant at the 1% level. There is a fairly strong correlation between early reading and early mathematics, which indicates that children with high scores in early reading tended to also have high scores in early mathematics. This was a strong trend but there is still some variation within it, meaning that, for example, some children might attain a very high score in early reading but a lower score in early mathematics. Vocabulary and phonological awareness were more weakly correlated with early reading and early mathematics. It is interesting to note that whilst vocabulary and phonological awareness are assessing elements of language acquisition and processing, they were more strongly correlated with early mathematics than with early reading.
4.3.1 Age
Next, the relationship between age at the start of Primary 1 and development level is investigated.
Figure 10: Correlations with age at the start of Primary 1
| Measure | Correlation with age at the start of Primary 1 |
|---|---|
| Total | 0.20** |
| Early Reading | 0.17** |
| Early Mathematics | 0.16** |
| Picture Vocabulary | 0.14** |
| Phonological Awareness | 0.14** |
** Significant at the 1% level * significant at the 5% level
The correlations between age at the start of Primary 1 and the PIPS total score and sub-scales were weak but all statistically significant. The level of significance suggests a high level of confidence in the relationship existing even though it is a weak one. The strongest correlation was seen for the total score. These correlations indicate a general trend of older children tending to achieve a higher score on the PIPS assessment than the younger children in the cohort at the start of Primary 1.
4.3.2 Gender
The differences between boys' and girls' scores on the PIPS assessment cognitive scale and sub-scales are reported in Figure 11. The mean difference has been transformed and is presented in months of development.
Figure 11: Differences between the sexes at the start of Primary 1
| Measure | Female advantage in months | Standard Deviation Male: Female |
|---|---|---|
| Total | 3.3** | 18.8 : 17.7 * |
| Early Reading | 3.6** | 22.5 : 21.6 |
| Early Mathematics | 0.5 | 20.5 : 17.5 ** |
| Picture Vocabulary | 5.4** | 26.3 : 25.0 |
| Phonological Awareness | 5.6** | 26.6 : 25.4** |
** Significant at the 1% level * significant at the 5% level
The significance of the Standard Deviations refers to a comparison of males and females expressed in months
On average, girls achieved higher scores at the start of Primary 1 than the boys in early reading, vocabulary and phonological awareness although the standard deviations show that there was a wide range of scores for both sexes. The difference is much smaller for early mathematics at just half of one month. The standard deviations were always greater for boys than girls suggesting that the highest and lowest scorers will have higher proportions of boys.
4.3.3 Deprivation
The Scottish Index of Multiple Deprivation (SIMD) was used as an estimate of each pupil's level of deprivation. The overall SIMD scale was divided into quintiles (five groups in which 1 is the most deprived and 5 the least deprived) and the correlations between PIPS scale and sub-scales, and the SIMD quintiles are reported in Figure 12.
Figure 12: Correlations with SIMD (quintiles) at the start of Primary 1
| Measure | Correlation with SIMD | Months between highest and lowest quintiles |
|---|---|---|
| Total | 0.27** | 14.4 |
| Early Reading | 0.23** | 15.4 |
| Early Mathematics | 0.23** | 13.0 |
| Picture Vocabulary | 0.19** | 13.8 |
| Phonological Awareness | 0.20** | 15.1 |
** Significant at the 1% level * significant at the 5% level
Figure 12 presents the correlation between SIMD quintiles and the cognitive measures. It also shows the differences in terms of months of development between children in the highest and lowest SIMD quintiles. The relationships between deprivation and cognitive development were significant but the correlations are weak. For the total score, children from the most affluent areas were 14.4 months ahead of the children from the most deprived areas. Looking in more detail there was a larger difference in early reading, phonological awareness and vocabulary than early mathematics.
Figure 13: The link between the PIPS total score and SIMD quintiles at the start of Primary 1
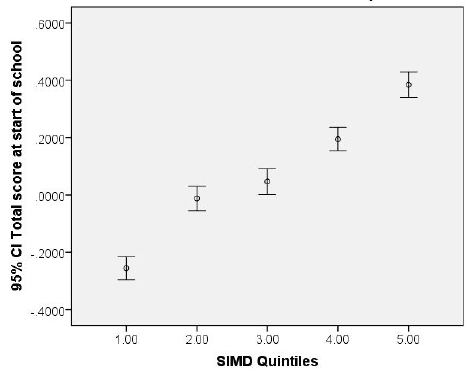
Figure 13 shows the mean and 95% confidence intervals[5] for the normalised PIPS total score at the start of Primary 1 by SIMD quintiles. The PIPS total score is shown on the vertical axis and the average score is zero. A clear trend is seen with the children from the lowest SIMD quintile having the lowest mean PIPS total score and those from the highest SIMD quintile having a correspondingly high mean PIPS total score.
Figure 14: Box and whisker plot of the PIPS total score by SIMD quintiles
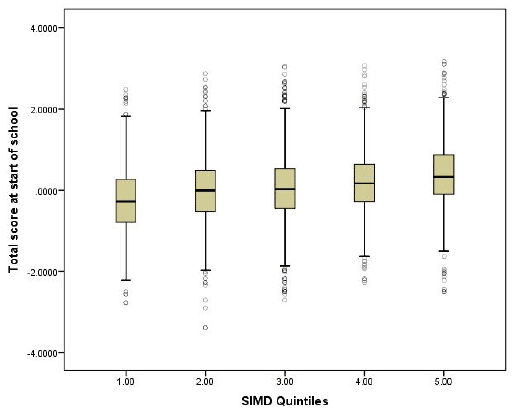
Figure 13 emphasised the clear relationship between pupils' SIMD quintiles and their PIPS score at the start of school. However, that method of presentation conceals the wide variation amongst pupils. Figure 14 shows the range of scores within each quintile. Each central box represents the range of scores of the middle 50% of pupils in the sample. The line in the middle of the box shows the score of the median pupil in the sample. The top and bottom whiskers encompass almost all cases and just a few outliers are shown above and below. The top 25% of children in the lowest quintile have higher total scores than the bottom 25% of the highest quintile.
4.3.3.1 Are boys or girls particularly affected by deprivation?
The possible differential effects of deprivation on boys and girls were investigated and Figure 15 shows the mean scores and 95% confidence intervals for the PIPS total score.
Figure 15: The link between the PIPS total score at the start of Primary 1 and SIMD by sex
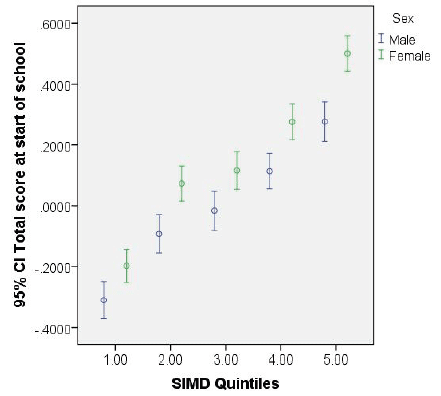
It has been suggested that there could be an interaction between sex and deprivation, with boys' development being further behind that of girls in the lower quintiles. Figure 15 shows that the girls' scores were higher than boys' within all quintiles. The boys' scores were not relatively lower than the girls' within the lowest quintile compared with higher quintiles. Differences between boys and girls actually increased by increasing quintile suggesting that there was a slightly bigger gap between the two groups in the highest quintile compared with the lowest.
4.4 Levels of personal and social development (PSD): differences between groups
Before investigating differences between groups, the mean scores and standard deviations for each scale within the personal and social development (PSD) assessment are presented. It should be noted that the sample size for PSD is much smaller than for the cognitive development scale. This was an optional part of the assessment which fewer teachers chose to complete.
Teachers were asked to observe their pupils for the first few weeks of Primary 1 before completing the PSD assessment. A pupil was assigned a score between 1 and 5 for each scale, with a score of 5 representing the highest level of development. The mean scores and standard deviations are shown in Figure 16.
Figure 16: PSD mean scores and standard deviations in the first term of Primary 1
| N | Mean | Standard Deviation | |
|---|---|---|---|
| Adjustment comfortable | 669 | 3.64 | 1.08 |
| Adjustment independence | 667 | 3.61 | 1.07 |
| Personal confidence | 667 | 3.47 | 0.98 |
| Personal concentration (self-directed) | 667 | 3.19 | 0.99 |
| Personal concentration (teacher-directed) | 660 | 3.22 | 0.95 |
| Personal actions | 660 | 3.47 | 0.96 |
| Social relationship (to adults) | 660 | 3.42 | 0.85 |
| Social relationship (to peers) | 660 | 3.59 | 0.86 |
| Social rules | 660 | 3.65 | 0.89 |
| Social cultural awareness | 660 | 2.72 | 1.04 |
| Social communication | 660 | 3.58 | 1.06 |
Figure 17 presents the mean score of each scale graphically.
Figure 17: PSD ratings in the first term of Primary 1
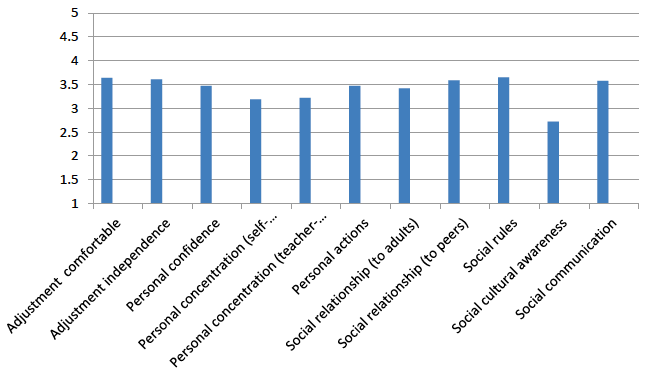
Children are rated most highly on their adjustment to the school setting, their independence within the school setting, relationships with peers, awareness of rules and communication. Cultural awareness was rated lowest of all. Another area with lower scores was concentration, both for self-directed activities and teacher-directed activities.
4.4.1 Age
Figure 18: Correlations between PSD and age in the first term of Primary 1
| Correlation with age | |
|---|---|
| Adjustment comfortable | 0.04 |
| Adjustment independence | 0.06 |
| Personal confidence | 0.05 |
| Personal concentration (self-directed) | 0.07 |
| Personal concentration (teacher-directed) | 0.04 |
| Personal actions | -0.03 |
| Social relationship (to adults) | -0.02 |
| Social relationship (to peers) | -0.05 |
| Social rules | -0.02 |
| Social cultural awareness | 0.08* |
| Social communication | 0.00 |
** Significant at the 1% level * significant at the 5% level
There is essentially no relationship between PSD and the age of the children. Although one correlation was statistically significant it was a very weak relationship. This contrasts with England where the relationship with age was stronger; older children scored more highly than younger children on Personal confidence (the correlation was 0.45) and the weakest correlation was for Social cultural awareness (0.23). Quite why differences are seen between England and Scotland in this respect is unclear. Perhaps it has something to do with pre-school preparation or attidtudes in the home or the approach taken to ratings by teachers.
4.4.2 Gender and deprivation
The differences between PSD ratings for boys and girls, and for pupils from different SIMD areas were investigated.
Figure 19: Differences in the mean PSD scores for gender and deprivation
| Female advantage | Most affluent - most deprived quintile | |
|---|---|---|
| Adjustment comfortable | 0.11* | 0.43** |
| Adjustment independence | 0.28** | 0.27 |
| Personal confidence | 0.20** | 0.11 |
| Personal concentration (self-directed) | 0.45** | 0.31* |
| Personal concentration (teacher-directed) | 0.41** | 0.43** |
| Personal actions | 0.44** | 0.24 |
| Social relationship (to adults) | 0.29** | 0.35** |
| Social relationship (to peers) | 0.25** | 0.16 |
| Social rules | 0.39** | 0.34** |
| Social cultural awareness | 0.26** | 0.45** |
| Social communication | 0.34** | 0.39* |
** Significant at the 1% level * significant at the 5% level
Several of the differences were statistically significant. The largest differences between boys and girls were seen on the concentration and personal actions scales where girls were almost half a point ahead of boys on the five-point scale. The personal actions scale measures elements of impulsivity and consideration of others. Taken together, they loosely encompass inattention, hyperactivity and impulsivity, which are traits more frequently displayed by boys than girls (Merrell and Tymms, 2001).
Children from the most affluent backgrounds scored more highly than those from the most deprived areas on the adjustment to school and concentration on teacher-directed activities.
4.5 Progress in cognitive development and PSD in Primary 1
4.5.1 Cognitive development
Figure 20 summarises the amount of progress in months made by children during Primary 1. This shows the impact of spending a year in school. As shown in the item maps earlier, children typically start Primary 1 being able to recognise some of the letters of the alphabet and recognising one or two high frequency words, recognising most single digits and a few teens. By the end of the year, many are competent in decoding many words and understanding their meaning, and performing arithmetic. In statistical terms, children made many months of progress in school compared with if they hadn't attended. Extrapolating from the rate of progress seen in Primary 1, it is estimated that if children did not go to school, it would take them more than four more years before they were able to read at the same level, and three years to perform at the same level in early mathematics. School really does make a difference.
Figure 20: Months of progress after the year in Primary 1[6]
| Measure | Progress in months |
|---|---|
| Total | 44** |
| Early Reading | 52** |
| Early Mathematics | 38** |
| Picture Vocabulary | 60** |
| Phonological Awareness | 28** |
** Significant at the 1% level * significant at the 5% level
Figure 21 shows the range of early reading and early mathematics scores at the start and end of Primary 1 using box and whisker plots[7].
Figure 21: The range of PIPS early reading and early mathematics scores at the start and end of Primary 1
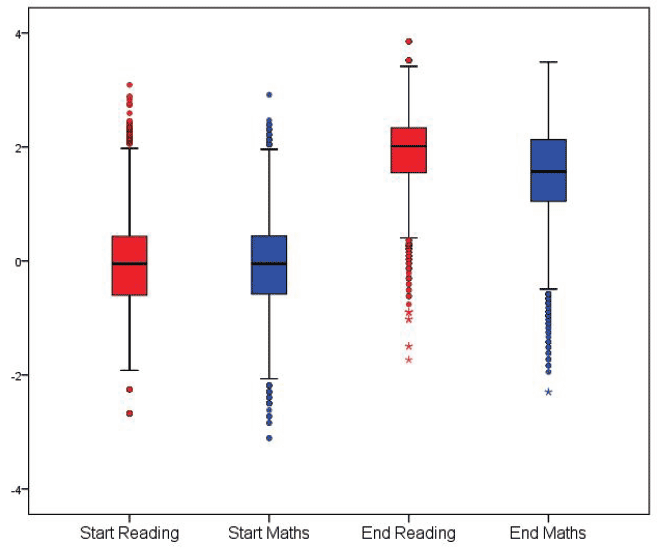
The reading scores changed dramatically from the start of the year to the end of the year. At the end of the year, the median score, corresponding to the 50th percentile[8], is in line with the top of the distribution at the start of the year. The children made many more months of progress in school than would be expected from natural maturation. These gains are not only statistically significant but also educationally very substantial.
Similar but slightly less dramatic progress was seen in early mathematics.
4.5.2 Differences between groups
4.5.2.1 Age, gender and deprivation
Figure 22 reports the differences in progress between older and younger children, boys and girls, and children from the highest and lowest SIMD quintiles on the PIPS total score and the sub-scales.
Figure 22: Differences in progress in Primary 1 related to key variables expressed in months
| Age (for one year older) | Sex (Female advantage) | SIMD (Top quintile advantage over lowest quintile |
|
|---|---|---|---|
| Total | -1.2 | 2.1** | 1.3 |
| Early Reading | -0.4 | 1.8** | 2.2** |
| Early Mathematics | 0.6 | - 1.7** | -0.4** |
| Picture Vocabulary | -4.3** | 0.2 | 2.2* |
| Phonological Awareness | -1.3 | 0.4 | 1.0 |
** Significant at the 1% level * significant at the 5% level
The results in Figure 22 indicate that the younger children make significantly more progress in vocabulary acquisition compared with their older peers; they begin to close the gap seen at the start of the year. The other age differences are not significant; older children and younger ones make a similar amount of progress over the year in reading, mathematics and phonological awareness.
Although statistically significant differences in progress were seen between boys and girls for early reading and early mathematics, these were very small in terms of gain in months (less than two months). Girls made more progress than boys in early reading but the reverse held for early maths.
Children in the least deprived SIMD quintile made more progress than their peers in the most deprived SIMD quintile for early reading and picture vocabulary (equivalent of over two months progress) where, perhaps, they are receiving more enriched support in their homes. But for early mathematics the children in more deprived areas caught up a little with their more affluent peers: the equivalent of 0.4 month of development.
NB We found no evidence that the link to disadvantage varies from school to school based on the sample - see Appendix F.
4.5.2.2 Deprivation
Multi-level models were used to investigate the amount of progress that pupils made taking into account their age at the start of Primary 1, SIMD and their PIPS total score at the start of Primary 1. These models take account of the grouping of pupils within different schools.
The models were used to produce Figure 23 which shows the difference in progress made by children in schools with high and low progress[9].
Figure 23: Differences in progress related to schools expressed in months (difference between schools which were one standard deviation above and below the mean school)
| School | |
|---|---|
| Total | 10** |
| Early Reading | 12** |
| Early Mathematics | 14** |
| Picture Vocabulary | 8.5** |
| Phonological Awareness | 8.3** |
** Significant at the 1% level * significant at the 5% level
There is a very large difference between schools in terms of the progress made by children during Primary 1. If we look at the amount of progress on the total score made by pupils in the school which was one standard deviation above average (on the 84th percentile) or one standard deviation below average (on the 16th percentile) then the difference between their progress is equivalent to 10 months.
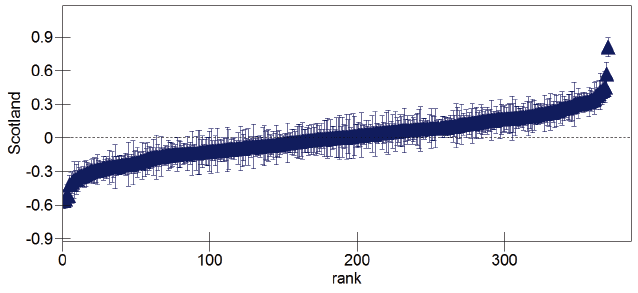
Figure 24 shows the mean residual[10] of each school for the PIPS total score with the standard error after controlling for (i.e. taking account of) age at the start of Primary 1, deprivation level and PIPS total score at the start of Primary 1. The standard error shows the range in which we are 95% confident the true scores lie. It enables the reader to see the distribution of schools' scores. Looking at the horizontal axis, pupils in those schools at the left side were making less progress than those on the right. The mean score is denoted by a triangle. (There are so many schools that the triangles in the diagrams merge together to look like a thick blue line.) If the confidence intervals overlapped with the middle horizontal axis, it was not significantly different from the mean. There were large differences between schools in the progress made. Not only was the average progress in Primary 1 larger than the impact of deprivation, age or sex on scores at the start of Primary 1 but the difference in progress across schools was larger than the impact of deprivation, age or sex on progress. More information about schools in England can be found in Tymms, Merrell and Henderson (1997).
Figure 24: School mean residuals with standard errors
4.6 Personal and social development
Although data were collected from more than 600 pupils during the first term of Primary 1, only 339 children were assessed again at the end of the year. Figure 25 shows the start of year scores of the initial sample of 669 children (labelled 'initial cohort' in the Figure), the start of year scores of those pupils who were assessed at both the start and end of Primary 1 (labelled 'sub-sample' in the Figure), and the end of Primary 1 scores for that sub-group (labelled 'repeat assessment' in the Figure).
Figure 25: Personal and social development at the start and end of Primary 1
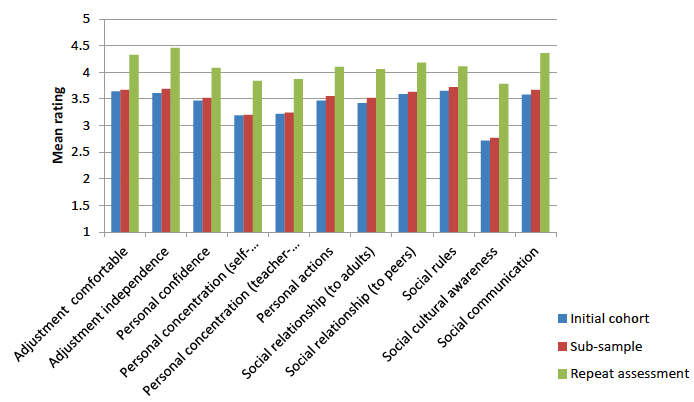
The scores at the start of Primary 1 for the sub-sample of children who were assessed at both time-points were close to the full sample. Progress during the year can be seen across all areas. At the start of the year, social cultural awareness was the lowest rated of the scales and large gains were seen by the end of the year.
4.6.1 Differences between groups
Figure 26 shows the differences between groups in the progress between the start and end of Primary 1.[11]
Figure 26: Change in raw score related to key variables
| Age (partial correlation) | Sex (Female advantage) |
SIMD (Top quintile advantage over lowest quintile) |
|
|---|---|---|---|
| Adjustment comfortable | 0.01 | 0.11 | -0.10 |
| Adjustment independence | 0.05 | 0.20** | 0.12 |
| Personal confidence | 0.02 | 0.15 | 0.50** |
| Personal concentration (self-directed) | -0.05 | 0.21* | 0.38* |
| Personal concentration (teacher-directed) | -0.02 | 0.33** | 0.29 |
| Personal actions | -0.08 | 0.39** | 0.22 |
| Social relationship (to adults) | - 0.12** | 0.37** | 0.25* |
| Social relationship (to peers) | - 0.10* | 0.22** | 0.16 |
| Social rules | - 0.01 | 0.38** | 0.32* |
| Social cultural awareness | 0.00 | 0.43** | 0.26 |
| Social communication | - 0.01 | 0.21* | 0.20 |
** Significant at the 1% level * significant at the 5% level
Age was generally unrelated to progress but girls tended to make more progress than boys. The children from less deprived backgrounds made more progress in confidence (half of one point on the five-point scale), self-directed concentration (a third of a point), relationships with adults (a quarter of a point) and attending to social rules (a third of a point).
Figure 27: Change in raw score related to school based on 26 schools and 339 cases[12]
| School | |
|---|---|
| Adjustment comfortable | 0.56* |
| Adjustment independence | 0.47* |
| Personal confidence | 0.41 |
| Personal concentration (self-directed) | 0.55 |
| Personal concentration (teacher-directed) | 0.75* |
| Personal actions | 0.59* |
| Social relationship (to adults) | 0.58* |
| Social relationship (to peers) | 0.55* |
| Social rules | 0.55* |
| Social cultural awareness | 1.00** |
| Social communication | 0.86** |
** Significant at the 1% level * significant at the 5% level
There were large differences in children's rates of progress in PSD across schools. The differences in Figure 27 were based on a comparison of the schools which were one standard deviation below the mean and one standard deviation above the mean. As with the cognitive measures, the comparison was between the schools on the 16th and 84th percentiles. The largest difference was seen for progress in cultural awareness amounting to one point on the five-point scale. The changes were invariably12 larger than the difference linked to sex, age or deprivation at the start of Primary 1 or when linked to progress.
Contact
Email: Wendy van der Neut
There is a problem
Thanks for your feedback