Transport and Travel in Scotland 2010
Summarises a broad range of transport statistics including road vehicles, traffic, casualties, bus and rail passengers, road and rail freight, air and water transport and personal travel as well as providing some comparisons with GB figures. Further breakdowns of Scottish Household Survey transport data including households' access to cars and bikes, frequency of driving, modes of travel to work and school, use and opinions of public transport and access to services are also presented.
4 Public transport, ferries and aviation
- Forty-four per cent of respondents used their local bus service in the last month, with 25 per cent using the train.
- Respondents in households earning over £40,000 per year were the least likely to have used the bus in the last month and the most likely to have used a train.
- Nearly a quarter of respondents had a regular bus service (at least 5 buses an hour) in 2010 (up from 19% in 2000) .
- Users were generally satisfied with both rail and bus services. Ninety-three per cent of users strongly agree or tend to agree that trains run on time. Seventy-three per cent of bus users strongly agree or tend to agree that buses run on time. Satisfaction with fares scored lowest.
- There was a noticeable difference in feelings of safety when travelling during the day and at night for both buses and trains.
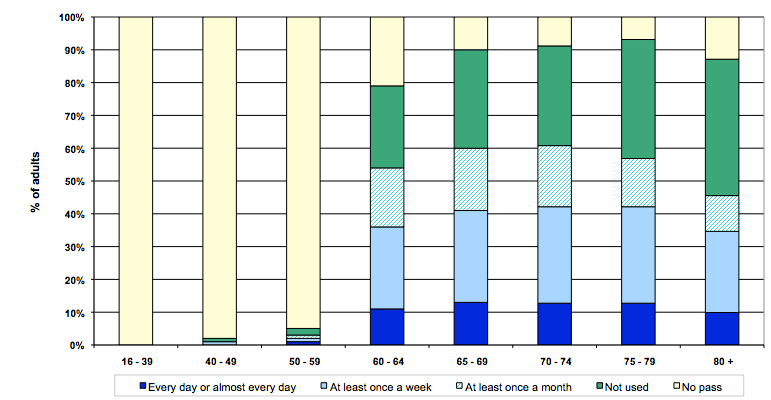
- Fifty-four per cent of those aged 60 or over used their concessionary pass at least once a month. Thirty-two per cent have a pass but haven't used it. Thirteen per cent have no pass.
- There were around 20.9 million air terminal passengers at airports in Scotland in 2010. Seven per cent less than in the previous year.
- Forty-four per cent of SHS respondents took a flight for leisure purposes in 2010 and 7 per cent for business.
- In 2010, almost 6 million passengers were carried on Caledonian MacBrayne, Northlink Orkney and Shetland and Orkney ferry services. This was 1 per cent lower than the previous year.
Local bus services
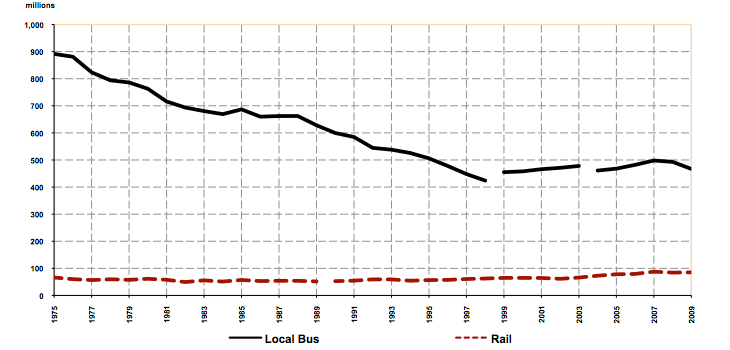
4.1 There were 467 million passenger journeys on local bus services in Scotland in the (financial year) 2009/10. This is a decrease (of 5.3%) on the previous year and a continuation of the downward trend from a peak of 498 million passenger journeys in 2007. These figures represent a revised series from 2004/05 onwards and caution is advised when comparing with data prior to 2004/05.
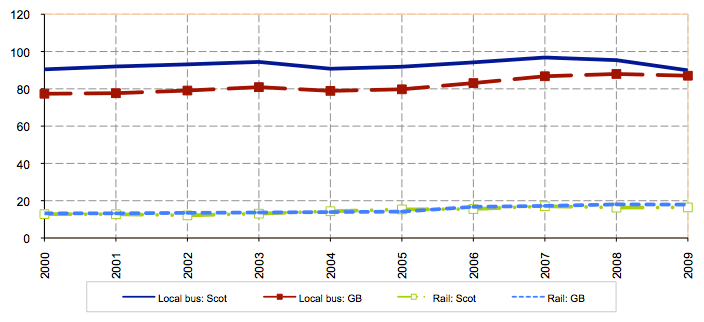
4.2 Longer-term trends show a decline in bus patronage. There were almost 1,700 million passenger journeys on local bus services in 1960. The number had almost halved by 1975. Since then, it has roughly halved again, from 891 million in 1975 to 467 million in 2009-10 with falls in almost every year between 1960 and 1999. Figure 13 shows the trends since 1975 and show (alongside Figure 14) that local bus passenger numbers are significantly higher than other modes of public transport.
Bus use
4.3 Around a quarter of respondents had a regular bus service (at least 5 buses an hour) in 2010. This is an increase of 5 percentage points since 2000. Eighty-five per cent lived within 6 minutes walk to a bus stop, although this may not be the bus stop that they regularly use. Twenty-two per cent have both, i.e. a regular bus service that is within 6 minutes walk from their house. [ Table S3]
4.4 Forty-four per cent of respondents had used the local bus service in the past month. This is an increase of 2 percentage points since 2002. [ Table S3]
Age/gender
4.5 Younger and older age groups were the most likely to use the bus, while less than 40 per cent of those aged between 30 and 59 used the bus in the past month. This is consistent with the results on frequency of driving, which showed that the 30 to 59 year age groups were the most likely to drive every day. [ Table 19]
4.6 Women were more likely to use the bus, with 47 per cent responding that they had used the bus in the last month, compared to only 39 per cent of men, again reflecting driving trends reported in Section 3. [ Table 27]
Income, deprivation and urban/rural
4.7 Urban areas, particularly large urban areas, had more frequent bus services. Forty-one per cent of households in large urban areas had a bus stop within 6 minutes walk of their home, with a frequency of at least 5 buses an hour. This compares to remote rural areas, where there were no households who were served by a bus stop with at least 5 buses an hour. [ Table 26]
4.8 Respondents in more deprived areas were more likely to have a good bus service (bus stop within 6 minute walk and 5+ buses per hour) than respondents in the least deprived areas (34% and 20%, respectively). [ Table 26] These results are linked to the findings in the previous paragraph as the majority of the areas with the highest levels of deprivation tend to be in urban areas.
4.9 Those in large urban areas were the most likely to travel by bus almost or every day (17% compared to only 3% of those living in remote rural areas). [ Table 27]
Satisfaction with service
4.10 In general, people were satisfied with bus services offered, their cleanliness and comfort, the ability to find out about tickets and routes and the ease of changing to other forms of transport with at least 73 per cent of respondents agreeing. [ Table 28]
4.11 There was a noticeable difference in those who felt safe on the bus during the day and in the evening. Ninety-one per cent of respondents agreed that they felt safe using the bus during the day compared to 59 per cent in the evening. [ Table 28]
4.12 'Fares are good value' also had the lowest agreement rate for buses with 59 per cent of respondents doing so. [ Table 28]
GB comparison
4.13 The SHS shows similar results to that of the GB (2010 NTS), which found that 29 per cent used the bus at least once a week (compared to 31% from the SHS).
Concessionary travel
4.14 The National Concessionary Travel Scheme was rolled out across Scotland in April 2006. The scheme enables individuals aged 60+ or those with certain types of disabilities to travel free on buses across Scotland.
4.15 Twenty-seven per cent of adults (16+) had a concessionary fare pass in 2010, and 87 per cent of those aged 60 or over. [ Table 4] However, only 54 per cent of respondents aged 60 or over actually used their pass at least once a month. [ Table 31]
4.16 Twenty-one per cent of respondents aged 60 to 64 did not have a pass, compared with 13 per cent or less for all older age groups. (Figure 11) [ Table 30]
4.17 Females were more likely to use their pass than males (60% and 49% respectively) and they tend to use it more frequently, with 44 per cent using it on a daily or at least weekly basis, compared to 31 per cent of males. [ Table 31]
4.18 Of all adults aged 60 or over, those who were permanently retired were more likely to have a pass than those in employment (90% and 74% respectively). This may indicate that those in employment are unaware that they are eligible for a pass or that they simply would not need one, for example if they choose to travel to work by car.
Figure 11: Possession and use of concessionary fare pass, 2010
4.19 Forty-two per cent of adults aged 60 or over and in lower income households (up to £10,000 per year) used their pass at least once a week compared to 31 per cent of those in households with over £20,000 per year. [ Table 31]
4.20 Frequency of driving had a considerable effect on how often concessionary passes were used by the over 60s. Of those who drove every day, only 19 per cent used their pass at least once a week compared to over 51 per cent of those who drove less than once a week. [ Table 31]
Young persons' concessionary travel
4.21 The Scotland-wide Concessionary Travel Scheme for Young People started on 8 January 2007. It allows all 16 - 18 year olds and young full-time volunteers up to the age of 25 concessionary travel on buses, rail and ferries throughout Scotland. The scheme provides a third off bus and rail travel throughout Scotland and two free return ferry journeys to the mainland each year if you live on a Scottish Island. A question on young persons' concessionary travel was added to the survey in 2008.
4.22 Of those aged 16 to 18, 27 per cent had a pass, with 18 per cent using it at least once a fortnight. No one over 18 had a pass in this survey. [ Table 30]
Rail passenger services
4.23 There were officially 78.3 million ScotRail passenger journeys recorded in 2010-11, 1.4 million (1.8 per cent) more than in the previous year.
4.24 Figure 15 shows that, from 1982 until 1996-97, passenger numbers remained between 50 million and 60 million per year. Latterly, rail patronage had been rising since 1994-95 and reached almost 65 million in 1999-00, but then fell to just over 61 million in 2002-03, before rising again to 78 million in 2010-11.
4.25 Over the last ten years, GB figures have increased more than Scotland. Figure 16 shows that, per head of population, there are fewer rail passenger journeys originating in Scotland than in Great Britain as a whole: 16 per head in Scotland in 2009-10, compared with 18 per head in Great Britain. Over the longer-term, the number of rail passenger journeys originating in Scotland (including cross-border journeys) fell from a peak of 73 million in 1964 to a low of 50 million in 1982.
Train use
4.26 Twenty-five per cent of respondents had used the train in the past month in 2010. This is an increase of 10 percentage points since 2002. Only 7 per cent used the train at least once a week. [ Table S3]
4.27 In 2010, 4 per cent of respondents travelled to work by train. [ Table S3]
Age
4.28 The younger the age group the more likely they were to have used a train in the last month. (Figure 12) [ Table 27] A third of those less than 30 used the train in the last month, compared to less than 20 per cent of those aged over 60.
Income
4.29 Train use increased as household income increased. Thirty-five per cent of those in households earning over £40,000 per year used the train at least once a month compared to 20 per cent of those in the lowest income households (up to £10,000 per year). [ Table 27]
Urban/rural
4.30 Those living in more rural areas were less likely to travel by train, with only 10 per cent of those living in remote rural areas using a train at least once a month compared to over 20 per cent of those living in urban areas and accessible towns. [ Table 27]
Satisfaction with service
4.31 In general, people were satisfied with train services offered, their cleanliness and comfort, the ability to find out about tickets and routes and the ease of changing to other forms of transport. [ Table 29]
4.32 There was a noticeable difference in feelings of safety on trains during the day and in the evening. Ninety-eight per cent of respondents agreed that they felt safe using the train during the day compared to 72 per cent feeling safe during the evening. [ Table 29]
4.33 Respondents were least likely to agree 'fares are good value' with only 58 per cent of respondents doing so. [ Table 29]
GB comparison
4.34 The SHS shows similar results to that of the GB (2010 NTS), which found that 7 per cent used the train at least once a week ( SHS shows 7% also).
Bus use compared to train use
4.35 Frequency of driving and driving licence possession had a significant effect on whether respondents travelled by bus. Thirty-two per cent of those holding a full driving licence had used the local bus service in the past month, compared to 70 per cent of those who didn't hold a full licence. Those who drove more frequently were less likely to travel by bus. However, train travel was comparatively unaffected by either frequency of driving or driving licence possession. [ Table 27]
4.36 Females were more likely to use the bus than males, while there was no difference in train use by gender. (Figure 12)
4.37 Adults aged 16 to 19 were much more likely to use the bus almost or every day than older age groups (23% compared to an average of 11% for all adults), however, 20-29 year olds were the age group most likely to use the train every day. Older age groups (60 and over) were more likely to travel by bus than those aged 30-59, while train use decreased as age increased. [ Table 27]
4.38 The lower the household income bracket the more likely it is that the respondent used the bus in the last month. This is in direct contrast to train use, which has a decreased likelihood the lower the household income, implying that the higher cost of rail travel is a deterrent to those on lower incomes. [ Table 27]
Figure 12: Adults who have used a bus or train in the past month, 2010
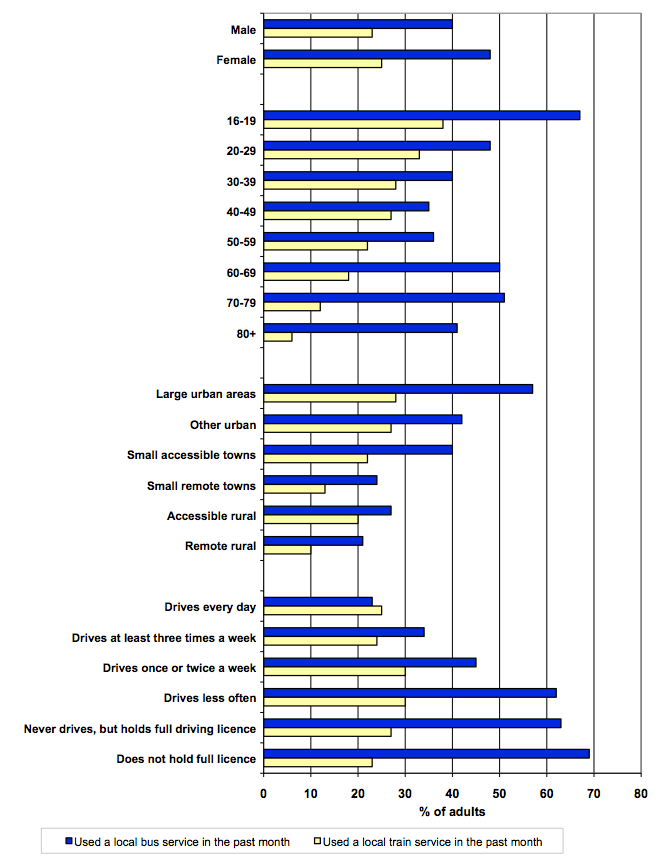
Figure 13 : Passenger numbers: local bus and rail
NB: Rail and bus figures are revised from 2004/05 onwards. See notes to table S1 and paragraph 4.4.
Figure 14: Passenger numbers per head of population: local bus and rail
Aviation
Air passengers
4.39 There were around 20.9 million air terminal passengers at airports in Scotland in 2010: 7 per cent less than in the previous year (some of this fall will be due to the ash cloud over Iceland), but 25 per cent more than in 2000. Figure 15 shows the increase since 1975. Over the longer-term, terminal passenger numbers grew from 1.2 million in 1960 to 20.9 million in 2010.
Air Travel
4.40 Forty-four per cent of respondents took a flight for leisure purposes in 2010 and 7 per cent for business. Around half of those taking leisure flights took 1 or 2 over the year, with about a quarter taking 3 or 4. Business travel shows quite different patterns with over half (53%) taking 7 or more trips. The most common reason for respondents choosing to fly within the UK as opposed to other forms of travel was because they viewed it as 'quicker', with the next most common reason being 'cheaper'.
UKComparison
4.41 Between 2000 and 2010, the number of air terminal passengers increased by 25 per cent for Scotland and 17 per cent for the UK as a whole. Over the past ten years, the number of passengers per head of population has been higher for Scotland than for the UK (4.0 vs. 3.4).
Ferry services
4.42 In 2010, almost 6 million passengers were carried on those shipping services within Scotland for which figures are available back to 1973 ( i.e. Caledonian MacBrayne, P& OScottish Ferries / NorthLink Orkney and Shetland, and Orkney Ferries). This was a decrease of 1 per cent on the previous year. Figure15 shows the long-term trends, which were affected by the reduction in traffic that followed the opening of the Skye Bridge in 1995.
Figure 15: Passenger numbers: rail, air and ferry (selected services)
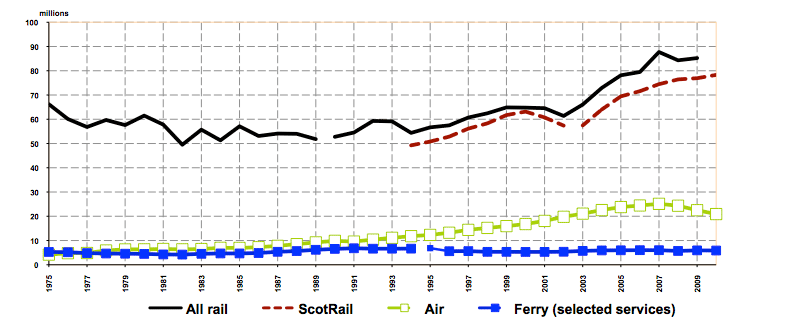
NB: Break in series for ScotRail figures due to change in methodology from 2003/04 onwards.
Figure 16: Passenger numbers per head of population: rail and air

There is a problem
Thanks for your feedback